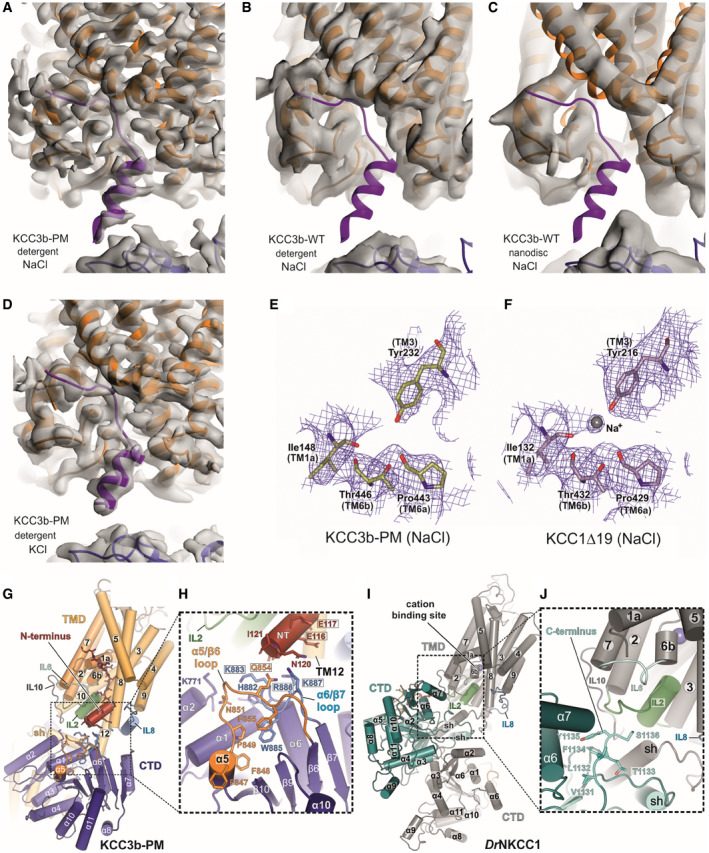
Figure EV2. Detailed comparison of CTD‐TMD interface of KCC3b and KCC1 structures (Related to Fig 2).

-
A–DCryo‐EM maps of KCC3b constructs determined in various conditions. Density for N‐terminal helix (purple cartoon) is visible in the cryo‐EM maps of KCC3b‐PM in detergent environments, in both potassium‐free (A) and potassium‐saturated (D) conditions. On the other hand, there is no density for the N‐terminal helix in the cryo‐EM maps of KCC3b‐WT in both detergent (B) and nanodisc (C) environments.
-
E, FComparison of KCC3b‐PM and KCC1∆19 at the cation‐binding site. Density for inorganic ion is not present in the KCC3b‐PM map (E), but it is present in KCC1∆19 (F), suggesting its inverse correlation with the presence of N‐terminal segment.
-
G–JDifferences in TMD/CTD interfaces between human KCC3b‐PM (G, H) and DrNKCC1 (I, J) as consequence of counter‐clockwise and clockwise interdomain twist which brings either N‐terminus (KCC3b) or C‐terminus (DrNKCC1) in close proximity to IL2. H: black frames highlight residues mutated to Ala for functional characterization in Appendix␣Fig S8.
