
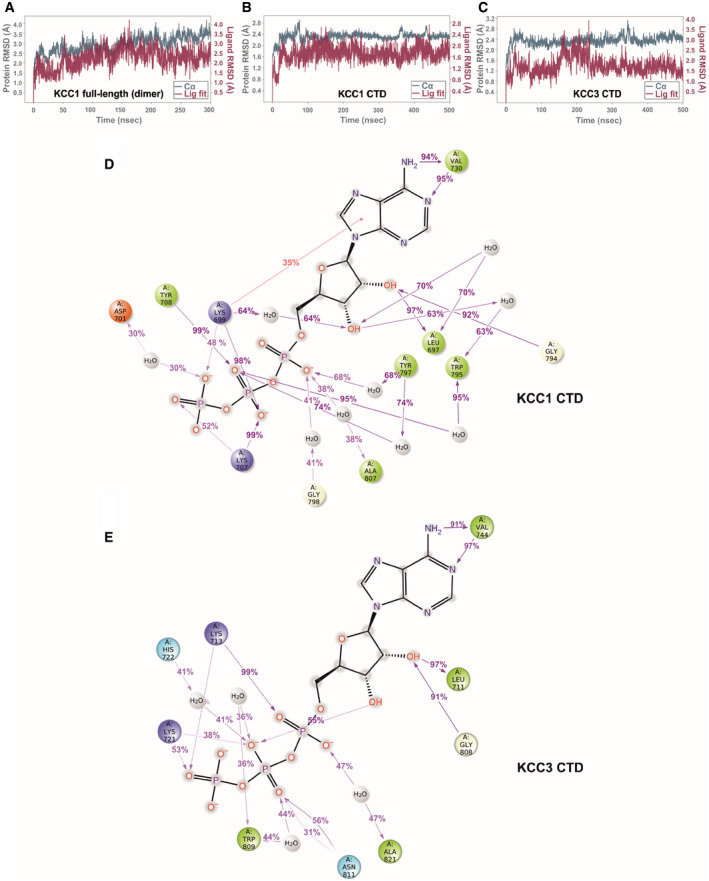
Figure EV5. MD simulation for ATP bound to KCC1 and KCC3 (Related to Fig 6).
-
AProtein RMSD (teal trace) and ligand RMSD (purple trace) over the course of a 300 ns simulation of ATP bound to the KCC1 dimer (construct Δ19, complete model with 175,573 atoms).
-
B, CProtein and ligand RMSD over the course of a 500 ns simulation of ATP bound to the isolated CTD of KCC1 (construct Δ19) and KCC3b (construct PM) with 42,461 and 39,805 atoms, respectively.
-
D, ELigand‐protein contacts for ATP, inferred from a 500 ns MD run of the isolated CTD KCC1 (construct Δ19) (D) and KCC3b (construct PM) (E), respectively. Charged interactions are shown in red (negative) or blue (positive), hydrophobic interactions are shown in green. Further details regarding the nature of protein‐ligand interactions are provided in the legend shown in Appendix␣Fig S12.