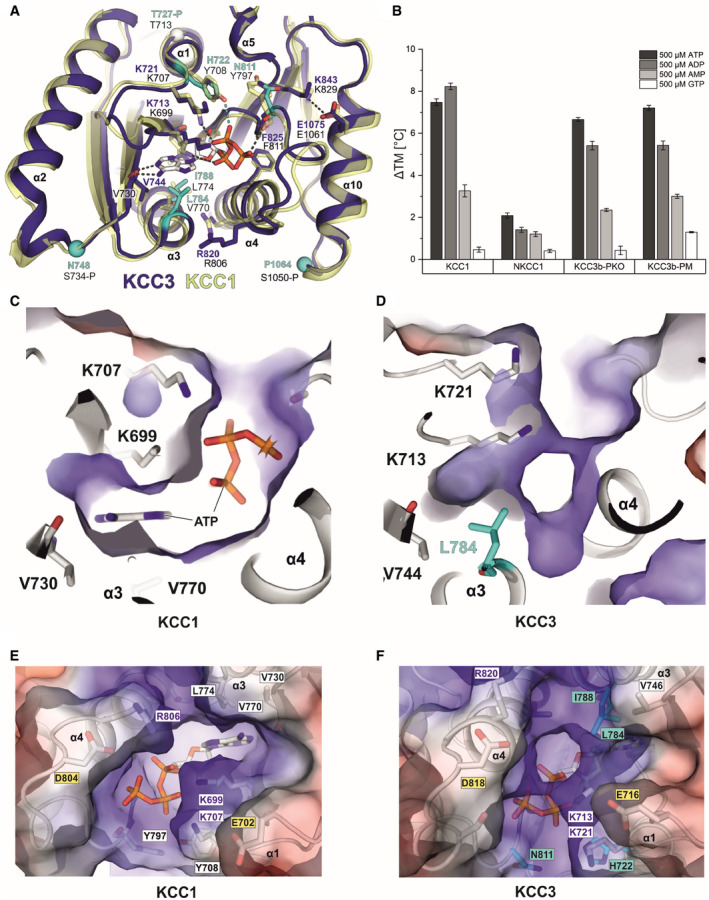
Figure 6. Comparison of nucleotide interactions of KCC1 and KCC3b by molecular dynamics simulations.

-
ASuperposition of the inner lobe of KCC1 (construct Δ19 in yellow cartoon representation) and KCC3b (construct PM in deep blue cartoon representation) with sequence differences in KCC3b highlighted in cyan.
-
BBar chart illustrating the extent of thermostabilization (ΔTM shift in melting temperature determined by nanoDSF) by different nucleotides at 500 µM of human KCC1, NKCC1, KCC3b‐PKO and KCC3b‐PM. Values are mean (± SE) from triplicates for each condition.
-
C–FElectrostatic surface representation of the ATP‐binding pocket in KCC1 (C, E) and the respective region in KCC3 (D, F). The surface is coloured by electrostatic potential (red, −5 kT e−1; blue,+5 kT e−1). Labels in cyan highlight residues different in KCC3, yellow labels indicate residues with potential roles in Mg2+ coordination or ATP hydrolysis. White labels highlight residues with a major role in nucleotide binding.
