-
A
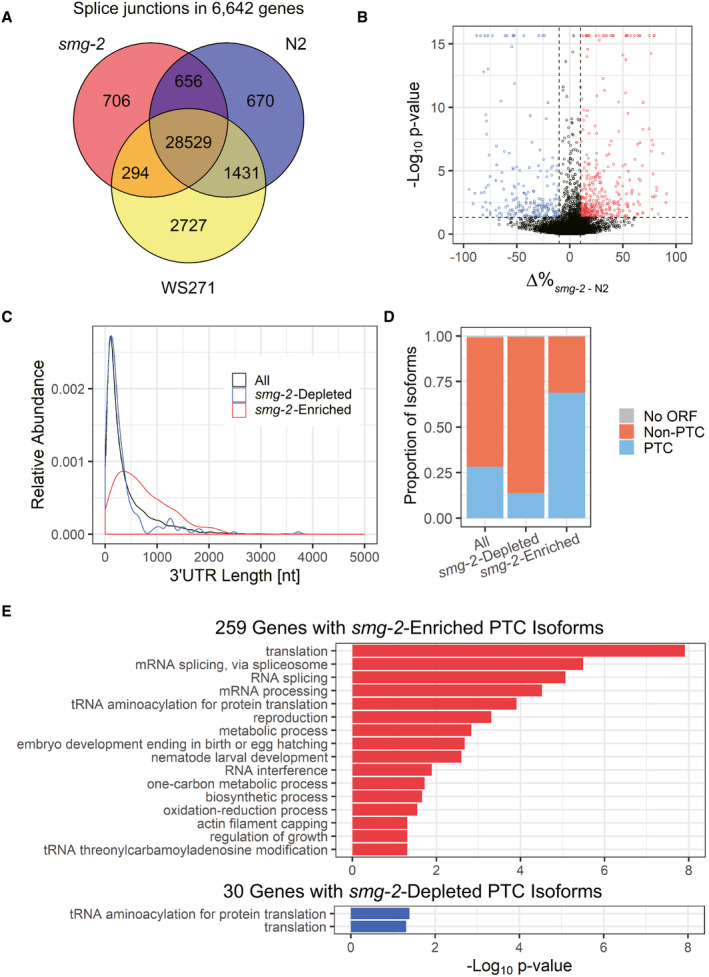
Venn diagram of exon‐exon junctions in 6,642 common genes identified among the Nanopore reads from the smg‐2
(yb979) mutant and wild‐type N2 as well as those deduced from gene models in WormBase (WS271).
-
B
Volcano plot of 8,701 mRNA isoforms from 2,931 genes with multiple isoforms. X‐axis indicates a difference in percentage of each mRNA isoform within the gene (Δ%
smg‐2
‐N2). Y‐axis indicates ‐log10 of P‐value in Fisher's exact tests. Blue symbols indicate 219 mRNA isoforms significantly depleted from the smg‐2 mutant (P < 0.05, Δ%
smg‐2
‐N2< −10). Red symbols indicate 420 isoforms significantly enriched in the smg‐2 mutant (P < 0.05, Δ%
smg‐2
‐N2> 10).
-
C, D
Length distribution of 3′UTRs (C) and proportions of putative PTC‐containing isoforms (D) in 10,136 mRNA isoforms detected in N2 and/or smg‐2 (All), the 219 isoforms depleted from and the 420 isoforms enriched in the smg‐2 mutant.
-
E
GO terms significantly enriched in 259 genes with smg‐2‐enriched PTC isoforms (top) and in 30 genes with smg‐2‐depleted PTC isoforms (bottom). Modified Fisher's exact P‐values in the DAVID Bioinformatics system are indicated. Note that 14 of the 30 genes with the smg‐2‐depleted mRNA PTC isoforms are common with those having smg‐2‐enriched PTC isoforms. This is why the same GO terms are enriched in these two groups. The mRNAs from such genes likely contain upstream open reading frames (uORFs), which may not be directly involved in or differentially affect NMD.

