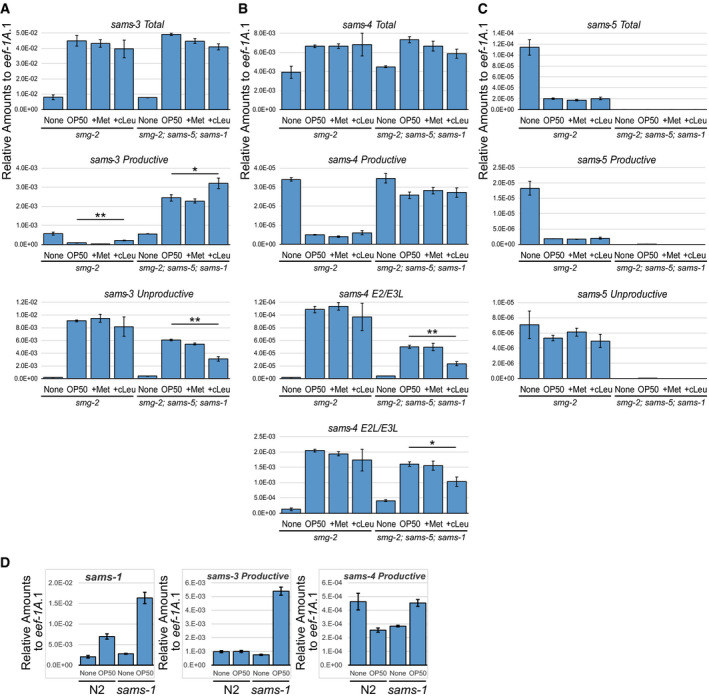
Relative amounts of
sams‐3 (A),
sams‐4 (B), and
sams‐5 (C) mRNA isoforms compared to
eef‐1A.1 (
n = 3, mean ± standard error of mean) in
smg‐2
(yb979) and
smg‐2
(yb979); sams‐5 (gk147); sams‐1 (ok2946) mutants. The same RT products were analyzed in Fig
3A. None, S‐complete medium alone; OP50, OP50 in S‐complete (OD
600=10.0); +Met, OP50 in S‐complete supplemented with 25 mM L‐Met; +cLeu, OP50 in S‐complete supplemented with 25 mM cycloleucine. *
P < 0.05; **
P < 0.01 (Student's
t‐test). Sequences of the primers are available in Appendix␣Table
S3.

