
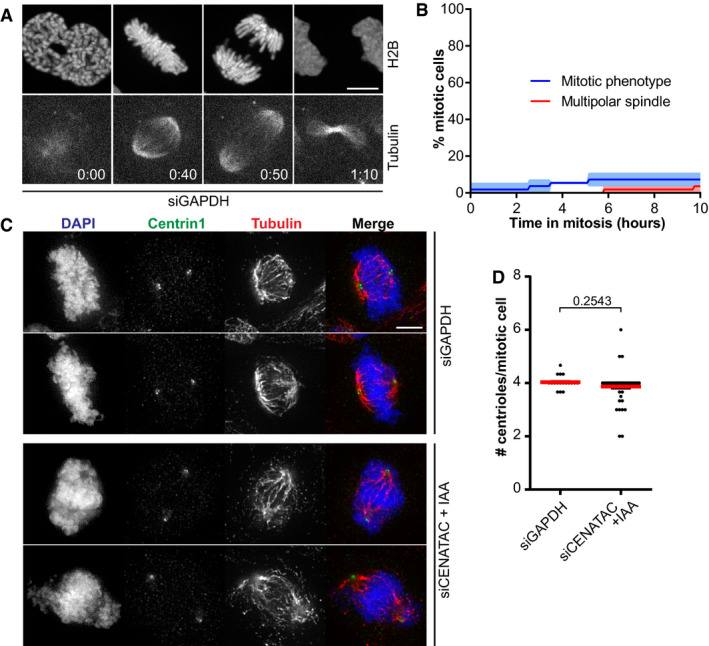
Figure EV2. CENATAC's congression phenotype is not the result of a multipolar mitotic spindle.
- A
-
BQuantification of the mitotic phenotype and multipolar spindle formation in time in cells treated as in (A) (three biological replicates, > 44 cells in total).
-
CRepresentative immunofluorescence images of HeLaEGFP‐AID‐CENATAC cells depleted of GAPDH or CENATAC and stained with antibodies against Centrin1 and Tubulin. IAA, 3‐indoleacetic acid. Scale bar, 5 μm.
-
DQuantification of the amount of centrioles per mitotic cell treated as in (C) (three biological replicates, > 60 cells in total).
Data information: In (B, D), data are presented as mean ± SEM. P‐values were calculated with unpaired Student's t‐tests.