
Figure 3. CENATAC is a novel component of the minor spliceosome.
-
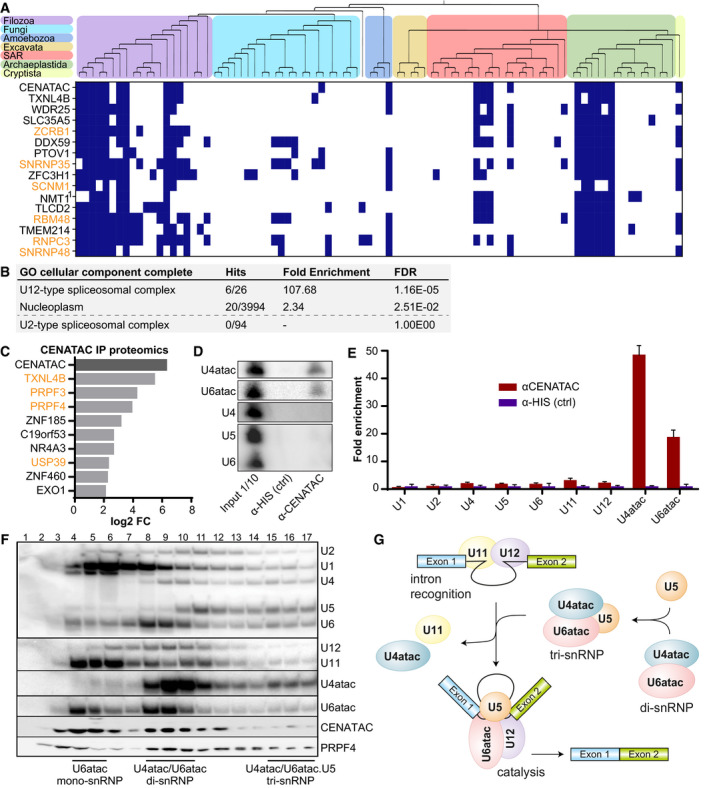
APhylogenetic profiles (presences (blue) and absences (white)) of the top 15 genes co‐occurring with CENATAC in 90 eukaryotic species. Top: phylogenetic tree of the eukaryotic species (see Table EV1) with colored areas for the eukaryotic supergroups. 1For NMT1, no human ortholog was found and instead the Arabidopsis thaliana ortholog is depicted. Genes associated with the minor (U12‐dependent) spliceosome are depicted in orange. See also Table EV2.
-
BGO term analysis of the genes co‐occurring with CENATAC as in (A) with a correlation score of > 0.5. Note: The amount of hits and fold enrichment score were manually changed to accommodate the recently discovered SCNM1 (Bai et␣al, 2021).
-
CGraph of fold changes in proteins enriched (P‐value < 0.05) in proteomics analysis of CENATAC vs. control co‐immunoprecipitations of HeLa EGFP‐CENATAC cells (three biological replicates). Splicing factors are depicted in orange. See also Appendix␣Fig S7.
-
D, EExamples (D) and quantification (E) of Northern blot analyses of minor (U6atac, U4atac, U11, and U12) and major (U2, U1, U4, U5, and U6) spliceosome snRNAs in HeLa EGFP‐AID‐CENATAC cells (three biological replicates, normalized to the control). See also Appendix␣Fig S8.
-
FGlycerol gradient (10–30%) analysis of HeLa S3 nuclear extracts. snRNAs were detected by Northern blot analysis, proteins (CENATAC and PRPF4) by Western blot. Locations of the U6atac mono‐snRNP, U4atac/U6atac di‐snRNP, and U4atac/U6atac.U5 tri‐snRNP are indicated.
-
GSchematics showing key assembly stages in minor intron splicing and minor tri‐snRNP assembly: intron recognition (A complex) and the catalytic spliceosome (C complex). For simplicity, several stages of spliceosome assembly are omitted, such as the pre‐B complex, which consists of the intron recognition complex together with the tri‐snRNP before architectural changes lead to the exclusion of U11 to give rise to the B complex, after which subsequent architectural changes lead to the exclusion of U4atac to give rise to the BACT complex, which is a precursor stage for the catalytically active C complex depicted in this figure (Turunen et␣al, 2013b).
Data information: In (C), data are presented as fold change of the mean log 2‐transformed LFQ intensity. In (E), data are presented as mean ± SD.