
Figure EV4. RT–PCR P120 reporter assay to measure the relative usage of GT‐AG and GC‐AG G‐type minor splice sites in direct competition.
-
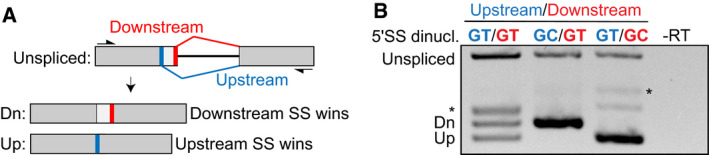
ASchematic diagram showing the overall architecture of the reporter construct with its down‐ and upstream splice site (thick red and blue bars, respectively) and the products created by splicing (Dn and Up, respectively). SS, splice site.
-
BRT–PCRs of the reporter with GT‐AG or GC‐AG splice sites in the down‐ or upstream positions as indicated above the gel. 5′SS dinucl., 5′SS splice site dinucleotides. *PCR product after use of a cryptic major splice site (not shown in the schematic).