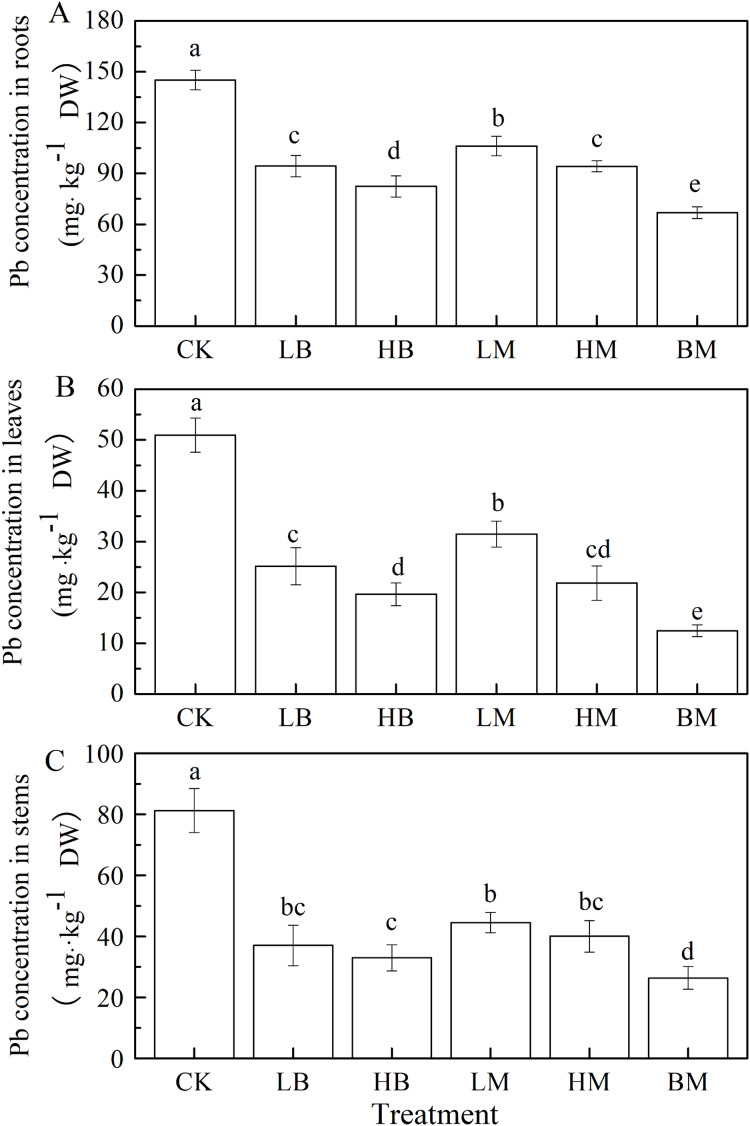
Figure 3. Pb concentrations in roots (A), leaves (B) and stems (C) of maize grown at Pb contaminated soil.
CK, LB, HB, LM, HM, BM represent the control, biochar application of 20 g·kg−1 soil, biochar application of 40 g·kg−1 soil, chicken manure application of 20 g·kg−1 soil, chicken manure application of 40 g·kg−1 soil, a combination of biochar and chicken manure (each at 20 g·kg−1 soil), respectively. Values are means (±SD) of four replicates; different lowercase letters indicate significant differences among different soil amendment treatments according to LSD at P < 0.05.

