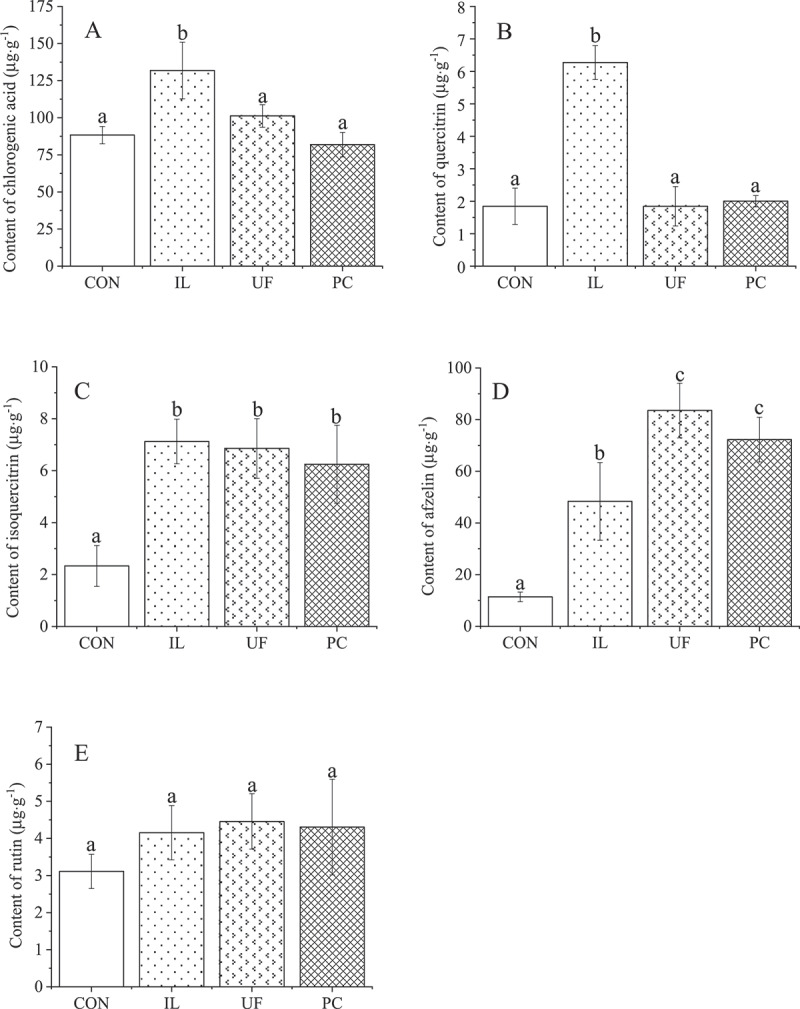
Figure 4.

Effects on phenolics of houttuynia cordata thunb. inoculated with endophytic fungi. values represent means ± standard deviation (n = 3). any two samples in the same bar chart with a different lowercase letter on the bar have significantly different mean values (P< .05), using tukey test. CON = control, IL = Ilyonectria liriodendra, UF = unidentified fungal sp., PC = Penicillium citrinum.
