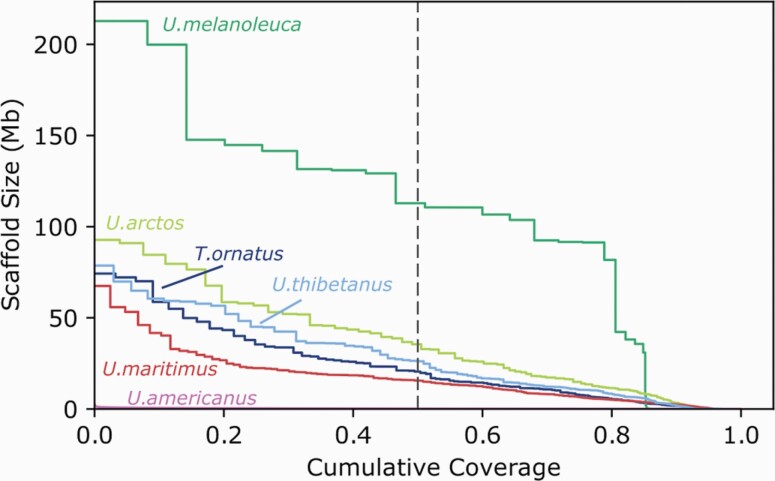
Figure 2.
NGx plot comparing scaffold-level contiguity of Andean bear assembly and other bear genomes. Plot shows the fraction of the genome (x-axis) that is covered by scaffolds of at least a certain size (y-axis). The dashed vertical line shows this value for half of the genome (N50). The Andean bear (T. ornatus) genome is shown in dark blue, with the giant panda (Ursus melanoleuca) in dark green, brown bear (U. arctos)in light green, Asiatic black bear (U. thibetanus) in light blue, polar bear (U. maritimus) in red, and American black bear (U. americanus) in pink. The American black bear genome was assembled using short read data alone, whereas all the others were assembled using a combination of short read, long read, and proximity ligation data. The assembly contiguity is similar to that of other the bear reference genomes that also employed a hybrid assembly approach.

