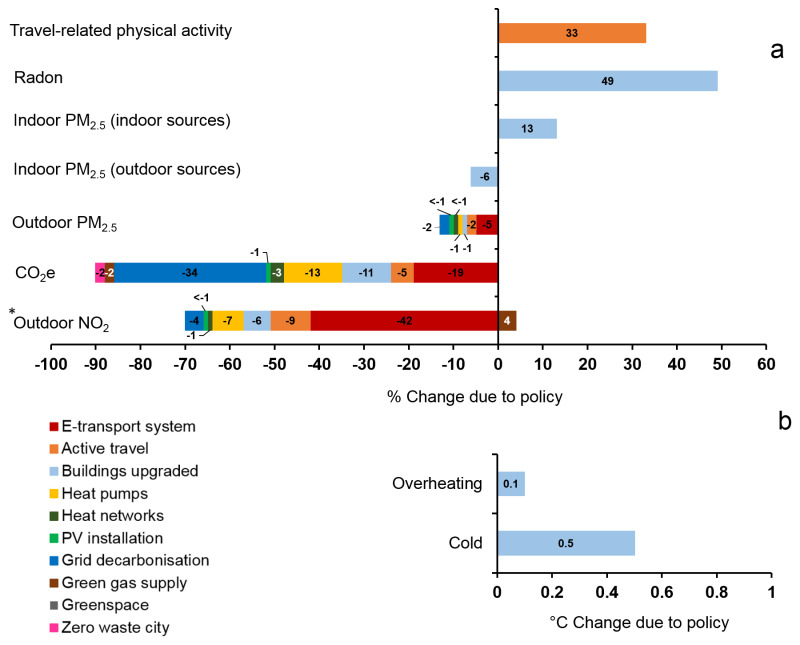
Figure 5.
( a) Central estimates of percentage changes in GHGs emissions (i.e. CO 2e), air pollution (outdoor PM 2.5, outdoor NO 2), indoor environmental quality (indoor radon, indoor PM 2.5 (indoor sources), indoor PM 2.5 (outdoor sources)), and transport (travel-related physical activity) due to the 10 policy actions in London (policy IDs are shown in colour). Left-hand side represent decrease (values shown in minus) and right-hand side represent increase in % changes due to policy. ( b) Central estimates of absolute degree changes of ‘Overheating’ and ‘Cold’ due to one policy action in London. *Please see Figure 6.

