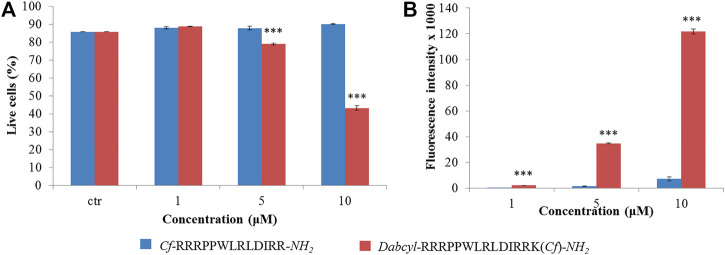
FIGURE 2.
Quantification of the internalization of Cf-RRRPPWLRLDIRR-NH 2 and Dabcyl-RRRPPWLRLDIRRK(Cf)-NH 2 into HL-60 cells by flow cytometry. The HL-60 cells were treated at different concentrations for 90 min and (A) the percent of live cells and (B) their average fluorescence intensity was determined by flow cytometry. Error bars show SD calculated based on three independent measurements. Statistical significance between the percent of live cells in the case of control and the peptide treated samples was determined with two-sided independent Student’s t-test (***p < 0.001) (A). Statistical significance between the internalization of two peptides was determined with two-sided independent Student’s t-test (***p < 0.001) (B).

