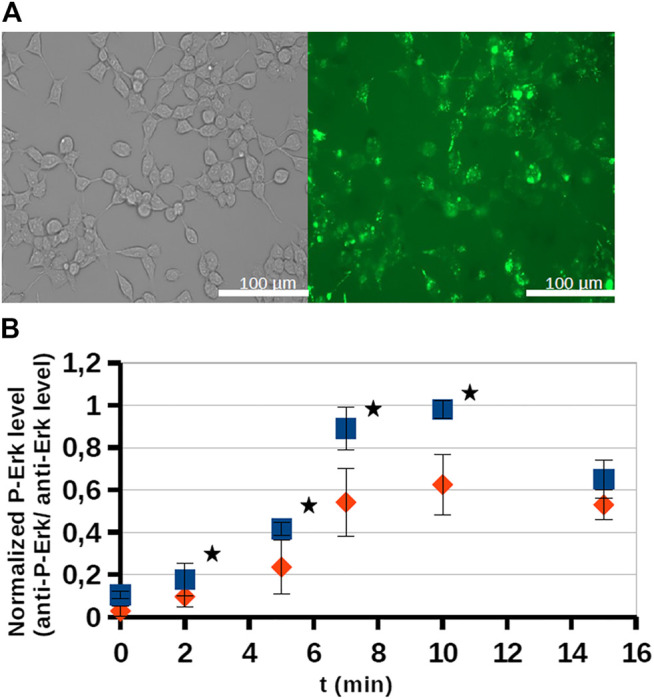
FIGURE 4.

Internalization and intracellular inhibitory activity of an octaarginine conjugate (3). The conjugate (3) treated cells (20 μM, 5 h) were analyzed by fluorescence microscopy (A), or stimulated by EGF (100 ng/ml). The activity of ERK-pathway was followed by anti-P-ERK antibody using Western-blots (B). The normalized phospho-ERK levels in untreated cells and peptide treated cells are labeled with blue and red, respectively. Error bars show SD calculated based on three independent measurements. * Indicates statistical significance between peptide-treated and control (p < 0.05 with two-sided independent Student’s t-test).
