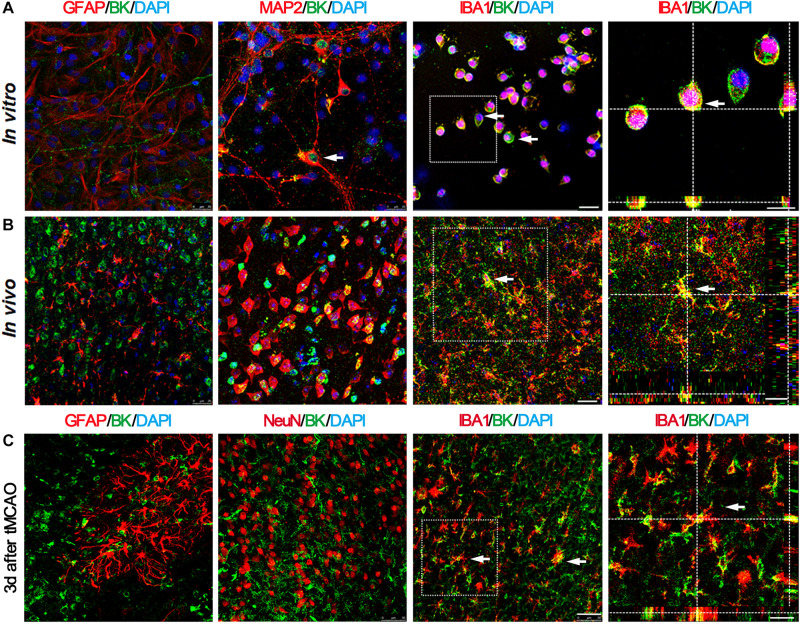
FIGURE 2.
BK channels are mainly expressed in microglia and neurons, but not in astrocytes. (A) Representative photomicrographs show BK (green), GFAP (red), MAP2 (red), and IBA1 (red) double staining in primary cultured cells. Scale bar = 25 μm. Right-side image indicates that BK is expressed in the IBA1+ microglia by 3D two-photo microscope image. Scale bar = 10 μm. (B) Representative photomicrographs show BK (green), GFAP (red), MAP2 (red), and IBA1 (red) double staining in the cortex of the normal mouse brain. Scale bar = 25 μm. Right-side image indicates that BK was expressed within the IBA1+ microglia, scale bar = 30 μm. (C) Representative photomicrographs of BK/GFAP, BK/NeuN, and BK/IBA1 double staining at 3 days after tMCAO. Scale bar = 50 μm. Right-side image indicated that BK was expressed in the IBA1+ microglia by 3D two-photo microscope image. Scale bar = 20 μm.

