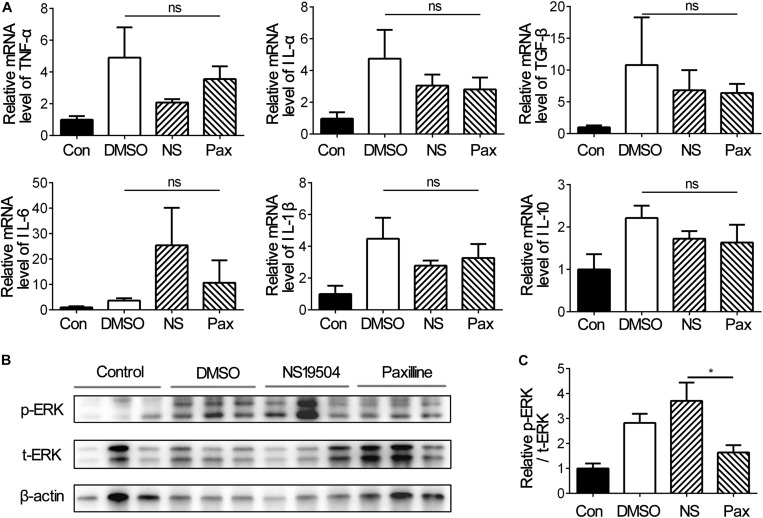
FIGURE 6.
Inflammatory factors and phosphorylated-ERK expressions under different treatments at 3 days after tMCAO. (A) Bar graph represents the relative mRNA levels of inflammatory factors including TNF-α, TGF-β, IL-10, IL-6, IL-1β, and IL-1α. Data are mean + SE, n = 3 per group. (B) Representative image of Western blot of phosphorylated-ERK1/2 (p-ERK), total-ERK1/2 (t-ERK), and β-actin at 3 days after tMCAO. (C) Bar graph showing the relative protein levels of p-ERK vs. t-ERK at 3 day after tMCAO. Data are mean + SE, n = 9 per group. *NS19504 vs. Paxilline group, *p < 0.05; ns, no significance.

