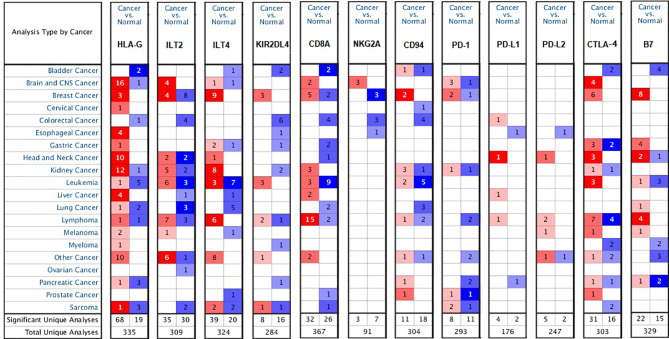
Figure 1.
Differential expression of the checkpoint molecules HLA-G, PD-1, CTLA-4 and their receptors in the various types of human tumors (ONCOMINE database). Graph shows the number of datasets with a statistically mRNA overexpression, based on the cut-off value of P < 0.05, fold change >1.5, and gene rank in the top 10% in the ONCOMINE database. Red represents over-expression, blue represents down-expression, and white represents no difference in tumors vs. normal adjacent tissues.

