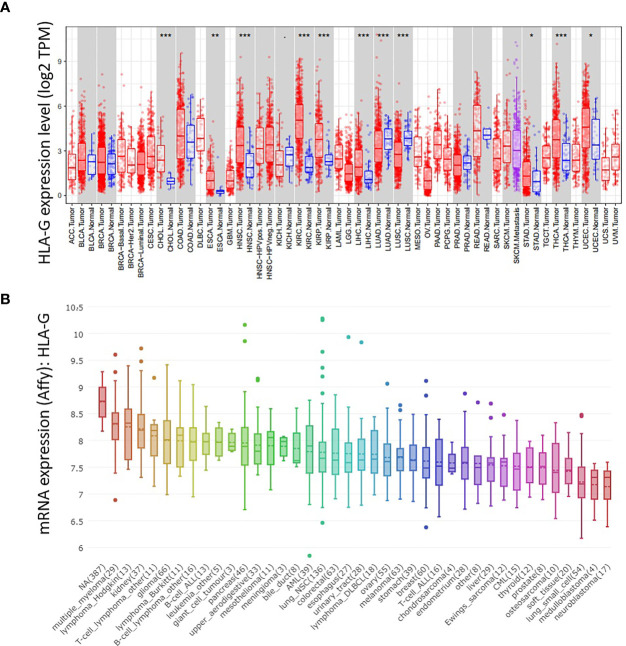
Figure 2.
The mRNA expression level of HLA-G in the various types of human tumors. (A) DiffExp module showing the differential expression between tumor and adjacent normal tissues for HLA-G mRNA across all TCGA tumors in the TIMER database. Up- or down-regulated in the tumors compared to normal tissues for each cancer type, as displayed in gray columns when normal data are available. P-value Significant Codes: 0 ≤ *** < 0.001 ≤ ** < 0.01 ≤ * < 0.05 ≤. < 0.1. (B) The mRNA expression of HLA-G in different cancer cell lines using Affy gene chip data in the CCLE database.

