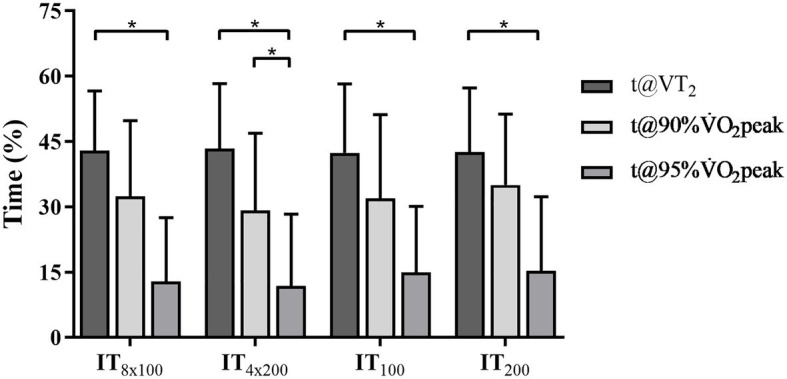
Figure 4.

The percentage of t@VT2, t@90%⩒O2peak, and t@95%⩒O2peak at IT8x100, IT4x200, IT100, and IT200. *Statistical difference intra interval training (IT) protocols (t@VT2 vs. t@90%⩒O2peak vs. t@95%⩒O2peak) at p ≤ 0.05. No differences were observed between the IT protocols (IT8x100 vs. IT4x200 or IT100 vs. IT200).
