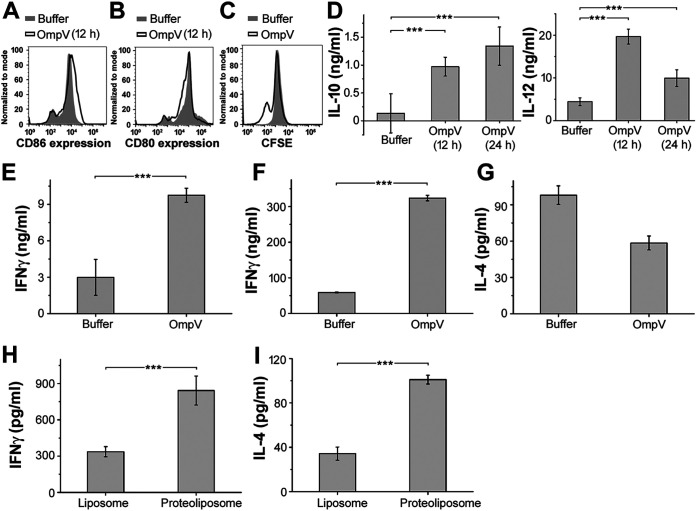
FIG 2.
OmpV induces dendritic cell maturation and Th cell differentiation. (A) Increased expression of CD86 in BMDCs activated with OmpV compared to the control. (B) No increase in CD80 expression in OmpV-treated BMDCs compared to the control. (A, B) BMDCs were pretreated with polymyxin B (PmB) followed by treatment with OmpV. Following incubations, the surface expression of costimulatory molecules CD86 and CD80 were analyzed by flow cytometry. (C) OmpV induces proliferation of Th cells as indicated by a decrease in CFSE fluorescence. CFSE-labeled CD4+ T cells were cocultured with splenic DCs targeted with OmpV. At day 3, CFSE fluorescence was detected using flow cytometry. CFSE-labeled CD4+ T cells treated with buffer were used as controls. (A to C) Histograms are representative of three independent experiments. (D) OmpV leads to the production of a high IL-12/IL-10 ratio. BMDCs were treated with PmB followed by OmpV. Following incubations, the supernatants were collected and estimated for IL-10 and IL-12 cytokines using an ELISA. (E) OmpV leads to the production of high levels of IFN-γ. CD4+ T cells were cocultured with OmpV-targeted splenic DCs for 3 days. The collected supernatant was probed for the presence of IFN-γ using an ELISA. (D, E) Bar graphs are expressed as mean ± standard error of the mean (SEM) from three independent experiments (*, P < 0.05; **, P < 0.01; ***, P < 0.001; ns, P > 0.05 versus the buffer-treated cells). (F, G) Treatment with purified OmpV leads to the production of high levels of IFN-γ in vivo. (H, I) OmpV-proteoliposome (PL) treatment leads to the production of both IFN-γ and IL-4 in vivo. OmpV or buffer was administered to mice intraperitoneally (4 doses a week apart) (F, G). Mice were immunized orally with four doses of OmpV-proteoliposome (PL)/liposome (H, I). Following 14 days after the last dose, cells were isolated from peripheral lymph nodes (F, G) or mesenteric lymph nodes (H, I) and activated with PMA and ionomycin. The supernatants were collected, and IFN-γ and IL-4 were quantified by ELISA. Bar graphs are expressed as mean ± SEM from three independent experiments; *, P < 0.05; **, P < 0.01; ***, P < 0.001; ns, P > 0.05 versus the buffer-treated mice (F, G) or mice immunized with liposome (H, I).

