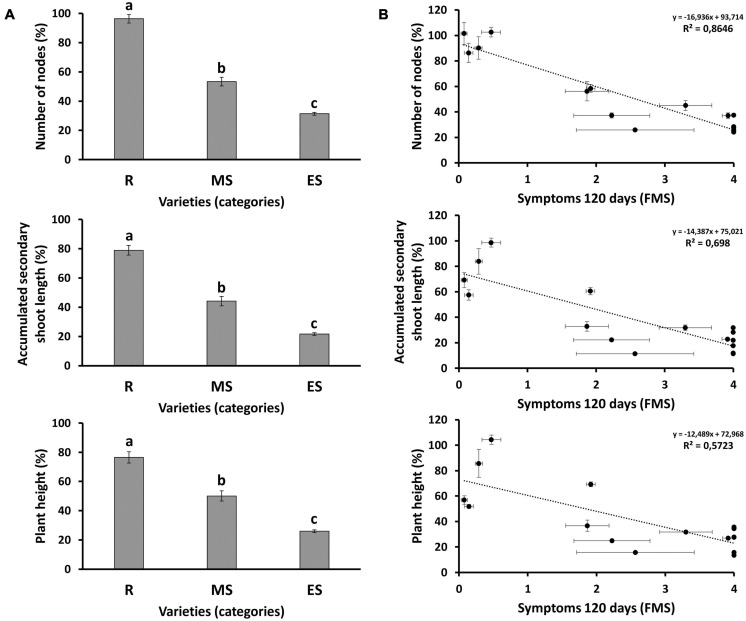
FIGURE 4.
(A) Morphological parameters in different groups of susceptibility at 120 days after inoculation (dai). Results are given as the average value of the different genotypes included in each group of susceptibility: R, resistant genotypes; MS, moderately susceptible genotypes; ES, extremely susceptible genotypes. For each genotype, the morphological value was normalized with the average value of the respective non-inoculated plants. Letters above bars represent significant differences at P < 0.05. (B) Correlations between morphological parameters and symptoms, measured as final mean severity of symptoms (FMS) at 120 dai. Scatter plots including the regression line, the regression equation and the coefficient of determination (R2) are given for each morphological parameter: number of nodes; accumulated secondary shoot length; and plant height. Bars and dots represent the average value of 12 plants normalized with the average value of the respective non-inoculated plants for each genotype. Error bars correspond to standard errors of the mean.

