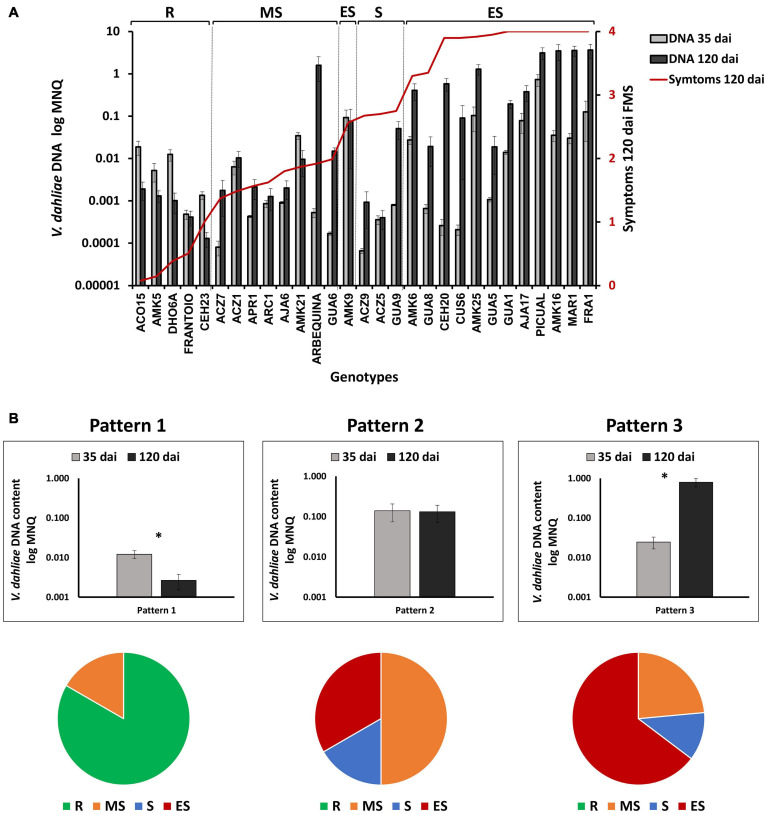
FIGURE 6.
(A) Evolution of Verticillium dahliae content after inoculation in genotypes tested in assays 1, 2, and 3 (A) Quantification of V. dahliae DNA (Mean Normalized Quantity, MNQ) in wild olive genotypes inoculated with the defoliating isolate VD117 of V. dahliae at 35 and 120 days after inoculation (dai). Bars represent the mean of 12 plants per assay, or 24 plants for those genotypes repeated in two different assays. The red line represents the average final mean severity (FMS) at 120 dai for each genotype. (B) Patterns of variation of V. dahliae DNA quantity between 35 and 120 dai (upper diagram), and relative content of genotypes according to the resistance level described by López-Escudero et al., 2007; lower diagram) for each pattern. Asterisks indicate significant differences at P < 0.05. The data were subjected to analysis of variance (ANOVA) and multiple comparisons of means were analyzed by Tukey’s HSD (Honestly significant difference). Error bars represent the standard error of the mean. R, resistant; MS, moderately susceptible; S, susceptible; ES, extremely susceptible.

