Figure 1.

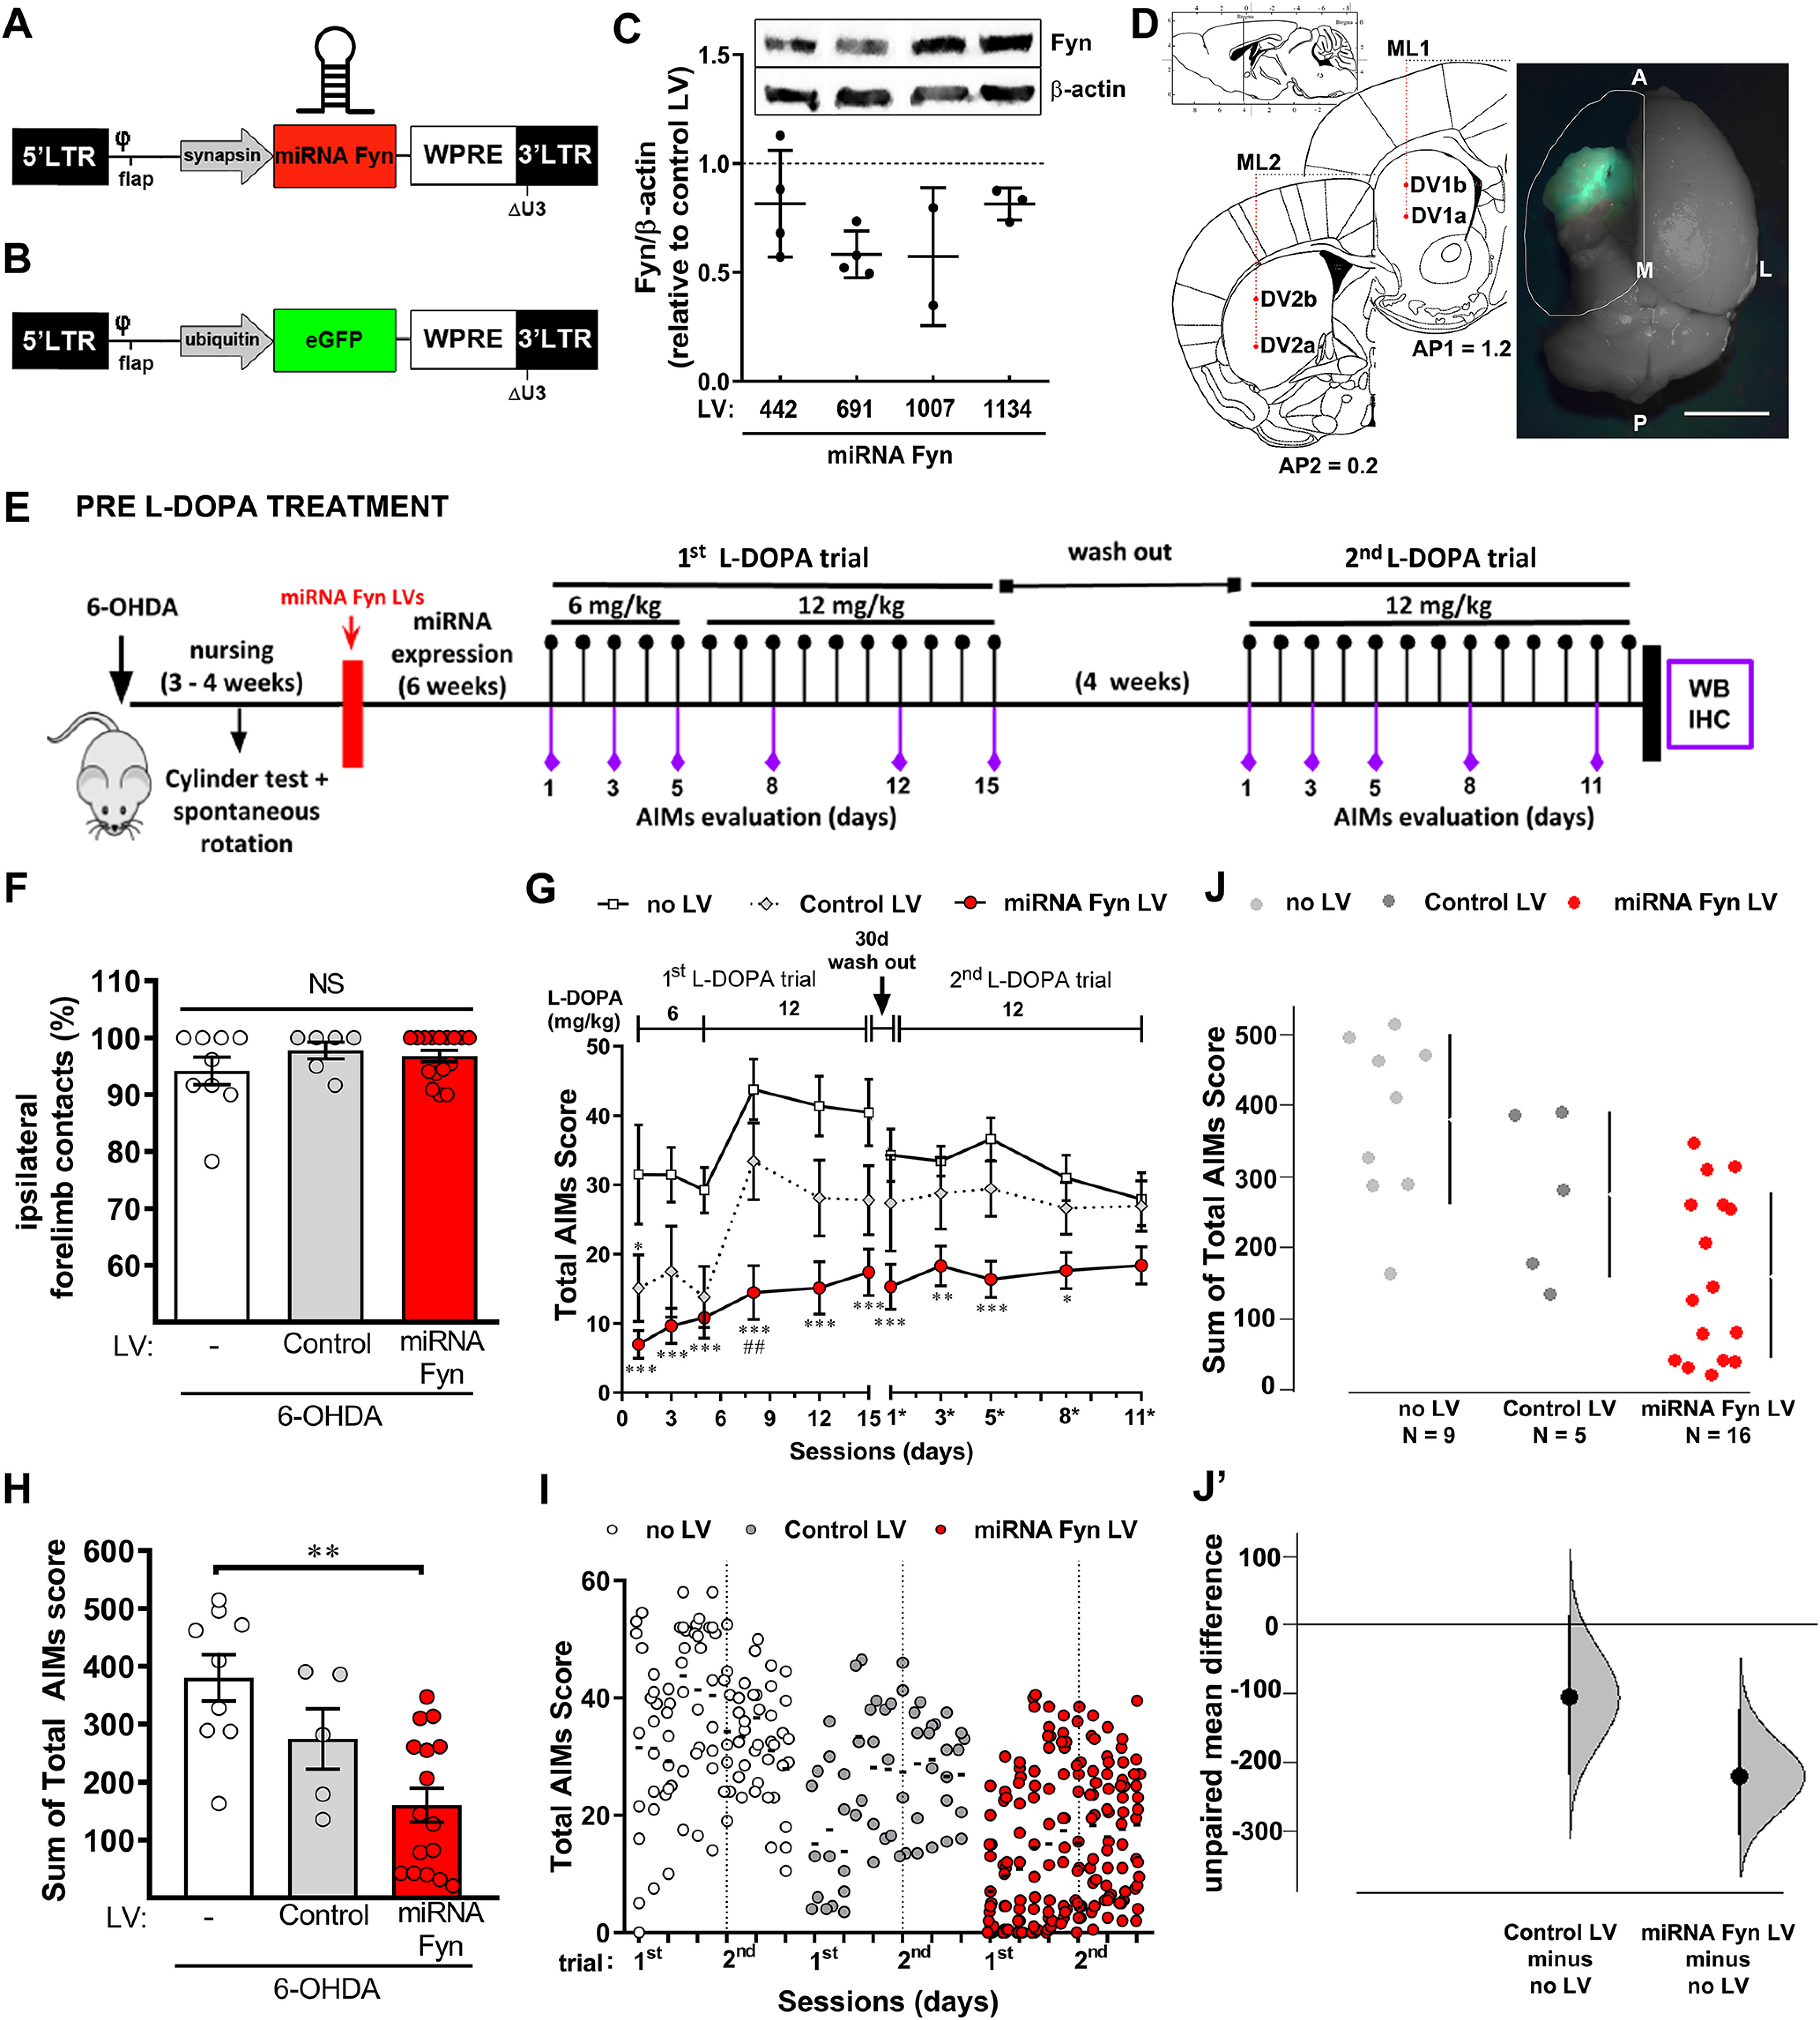
miRNA strategy to reduce striatal Fyn as a preventive treatment for LID. A, B, Schema of LVs used to express the miRNA (miRNA) to target Fyn (A) or the reporter gene GFP (B), used to set the coordinates for the intrastriatal injections. C, Western blot quantification of Fyn/β-actin protein levels in mouse N2a cell-line treated with each miRNA LV. Data are expressed relative to control-LV-treated cells. We selected the miRNA-Fyn 691 because it reduced Fyn amounts in four independent experiments. D, Coronal schemes depicting the injection sites used to deliver LVs into the striatum. Overview of striatal expression of the reporter GFP. Scale bar: 5 mm. A: anterior; P: posterior; M: medial; L: lateral, AP: antero-posterior; ML: medio-lateral; DV: dorso-ventral. E, Timeline of the preventive paradigm used: 6-OHDA lesion into the MFB, striatal miRNA LV injection, L-DOPA administration and behavioral analyses followed by postmortem analysis. F, Cylinder test performed after 6-OHDA lesion, prior to random assignment of mice to treatment groups. Data are mean ± SEM. Kruskal–Wallis test H(2) = 1.211; p = 0.5457. G, Sum of values for axial dystonia, orolingual and limb dyskinesia (total AIMs score) per day throughout the L-DOPA treatment. Experimental groups: non-injected (no LV; n = 9), injected with control LV (n = 5), or with miRNA-Fyn LV (n = 16). Data are mean ± SEM. Two-way ANOVA with repeated measures (interaction: F(20,270) = 3.440, p < 0.0001; time: F(10,270) = 13.08, p < 0.0001; treatment: F(2, 27) = 10.32, p = 0.0005; subject: F(27,270) = 35.33, p < 0.0001) and post hoc Tukey’s test; *p < 0.05, **p < 0.01, and ***p < 0.001 versus no LV; ## versus control LV. H, Sum of total AIMs score from all sessions. Data are mean ± SEM. Kruskal–Wallis test (H(2) = 12.52; p = 0.0019) followed by Dunn’s test (p = 0.0014, no LV vs miRNA-Fyn LV). I, Dot plot of data showing the distribution of AIMs score within each group. The dotted line separates the first from the second L-DOPA trial. J, J’, Sum of total AIMs score analyzed by estimation statistic shown as a Cumming estimation plot. On the upper axes (J), the raw data are presented as a swarmplot and mean ± SD are represented on the right of each experimental group as a gap between the vertical lines and vertical lines, respectively. On the lower axes (J’), the unpaired mean difference for two comparisons against the shared control (no LV group) are shown. The unpaired mean differences (Mdiff) are plotted as bootstrap sampling distributions. Each mean difference is depicted as a dot. Each 95% CI is indicated by the ends of the vertical error bars. Unpaired Mdiff (control LV vs no LV) = −106 and 95.0% CI [−234.0, 5.7] with a p = 0.134 for the two-sided permutation t test. Unpaired Mdiff (miRNA-Fyn LV vs no LV) = −220 and 95.0% CI [−300, −112] with a p = 0.0006 for the two-sided permutation t test.
Figure Contributions: M. Elena Avale and Juan E. Ferrario designed miRNA-Fyn sequences. Melina P. Bordone cloned the vectors. M. Elena Avale and Ana Damianich prepared LVs particles. M. Alejandra Bernardi and Melina P. Bordone performed in vitro experiments and Western blot detection. Ana Damianich and Juan E. Ferrario set the striatal injection sites. Melina P. Bordone performed 6-OHDA lesions and Ana Damianich striatal lentiviral injections. Melina P. Bordone, Ana Damianich, Tomas Eidelman, and Juan E. Ferrario made animal nursing and cylinder tests. Melina P. Bordone, Tomas Eidelman, and Sara Sanz-Blasco scored LIDs. Melina P. Bordone performed statistical analyses and Melina P. Bordone, Juan E. Ferrario, and M. Elena Avale analyzed and discussed data.
