Figure 2.

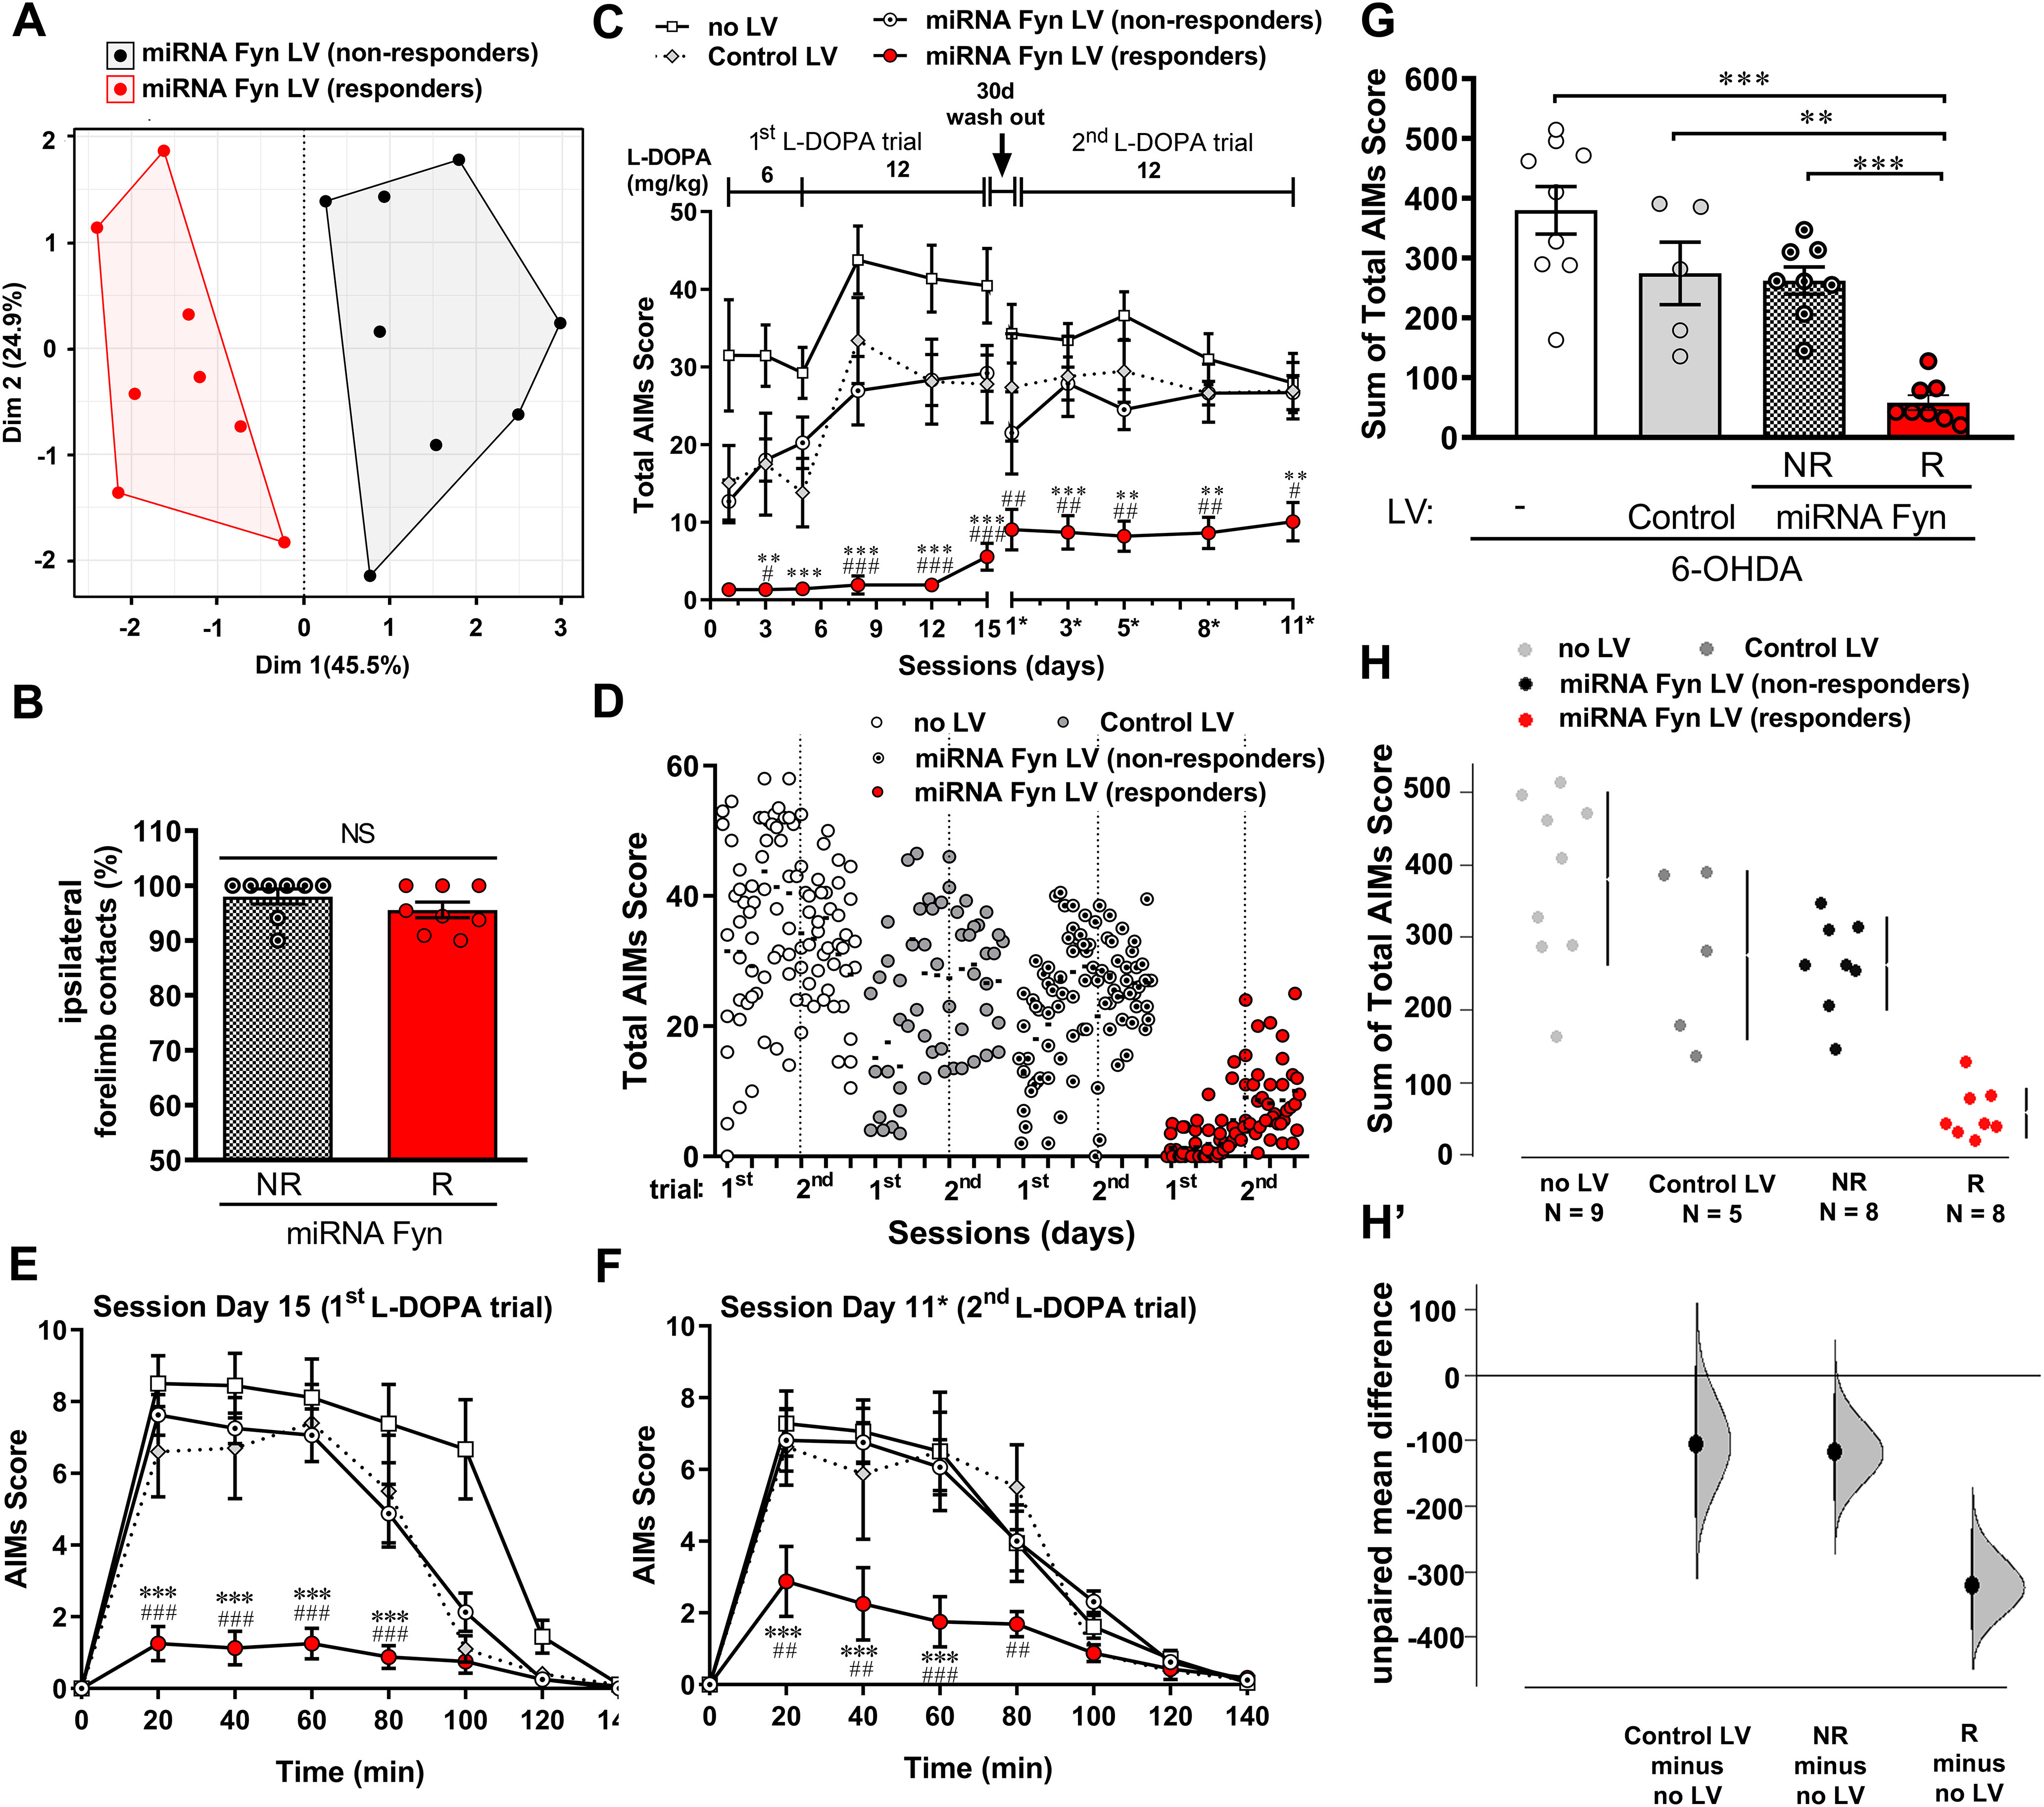
miRNA-Fyn treatment prevents the development of LID. A, Factor map after HCPC split miRNA Fyn-injected mice into two groups assigned as R (n = 8) and NR (n = 8). B, Cylinder test from miRNA Fyn-treated mice split into R and NR. Data are mean ± SEM. Two-tailed unpaired Student’s t test (t = 1.236, df = 14, p = 0.2367). C, Total AIMs scores (as Fig. 1G) after discriminating R and NR miRNA-Fyn mice. Data are mean ± SEM. Two-way ANOVA with repeated measures (interaction: F(30,260) = 3.361, p < 0.0001; time: F(10,260) = 14.12, p < 0.0001; treatment: F(3,26) = 18.96, p < 0.0001; subject: F(26,260) = 21.63, p < 0.0001) and post hoc Tukey’s test; **p < 0.01, ***p < 0.001 versus NR; #p < 0.05, ##p < 0.01, and ###p < 0.001 versus control LV. D, Dot plot of data showing the distribution of AIMs score after clustering miRNA-Fyn LV mice into R and NR groups. Dotted line separates the first and second L-DOPA trial. E, F, AIM score for session day 15 (from the first trial with L-DOPA; E) and day 11* (from the second trial with L-DOPA; F). Data are mean ± SEM. E, Two-way ANOVA with repeated measures (interaction: F(21,182) = 10.21, p < 0.0001; time: F(7,182) = 97.39, p < 0.0001; treatment: F(3,26) = 17.01, p < 0.0001; subject: F(26,182) = 6.068, p < 0.0001). F, Two-way ANOVA with repeated measures (interaction: F(21,175) = 3.522, p < 0.0001; time: F(7,175) = 64.41, p < 0.0001; treatment: F(3,25) = 7.497, p = 0.0010; subject: F(25,175) = 3.394, p < 0.0001) both followed by post hoc Tukey’s test; ***p < 0.001 versus NR; ##p < 0.01 and ###p < 0.001 versus control LV. G, Sum of total AIMs score from all sessions (as Fig. 1H) after discriminating R and NR mice. Data are mean ± SEM. One-way ANOVA (F(3,26) = 18.96, p < 0.0001) and post hoc Tukey’s test (p < 0.0001, p = 0.0013 and p = 0.005 for R vs no LV, control LV and NR, respectively). H, H’, Sum of total AIMs score analyzed by estimation statistic shown as a Cumming estimation plot (as Fig. 1J,J’) after discriminating R and NR mice. H, The raw data are presented as a swarmplot and mean ± SD are represented on the right of each experimental group. H’, Unpaired mean difference for three comparisons against the shared control (no LV group). The unpaired Mdiff are plotted as bootstrap sampling distributions. Each mean difference is depicted as a dot and the 95% CI is indicated by the ends of the vertical error bars. Unpaired Mdiff (control LV vs no LV) = −106 and 95.0% CI [−234.0, 5.7], unpaired Mdiff (NR vs no LV) = −118 and 95.0% CI [−196.0, −28.4], and unpaired Mdiff (R vs no LV) = −322 and 95.0% CI [−390, −234] followed by two-sided permutation t test with p = 0.134, p = 0.0306, and p = 0.0002, respectively. Figure Contributions: Melina P. Bordone performed the multifactorial analysis, clustering, and statistical analyses. Presentation of data and results were discussed with Oscar S. Gershanik, M. Elena Avale, and Juan E. Ferrario.
