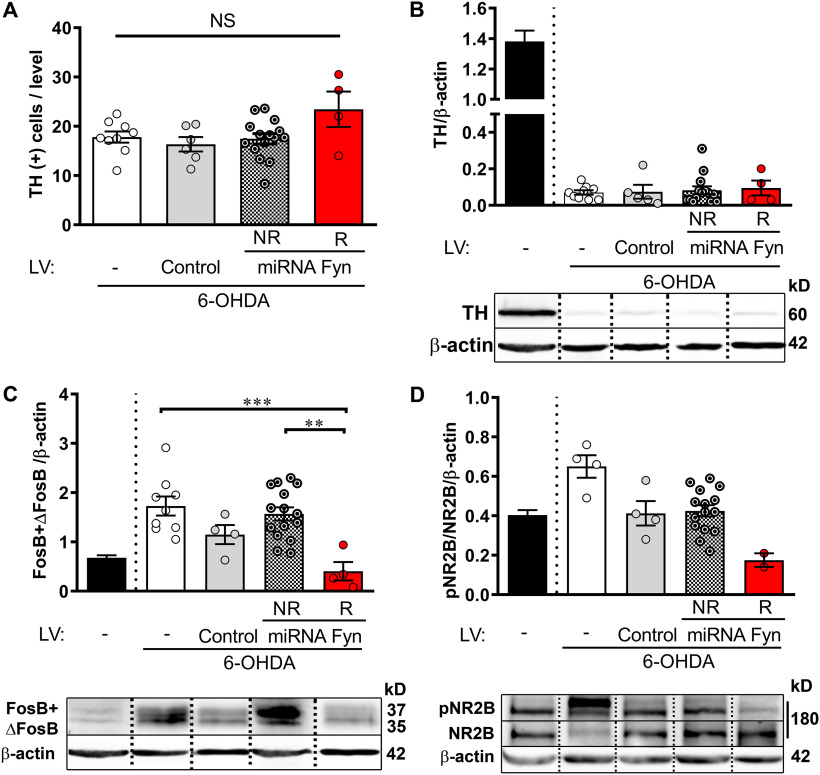
Figure 6.
Postmortem analysis of post-L-DOPA miRNA Fyn treatment. A, TH-positive cell counting at the SNpc from immunohistochemical staining of coronal slices. One-way ANOVA (F(3,30) = 2.596, p = 0.0708). B, Analysis of dopamine depletion by Western blot quantification of TH/β-actin. Kruskal–Wallis test H(3) = 0.6519; p = 0.8844. C, FosB-ΔFosB levels relative to β-actin. One-way ANOVA (F(3,28) = 7.174, p = 0.0010) and post hoc Tukey’s test (p = 0.0010 for no LV vs R and p = 0. 0020 for R vs NR). D, Detection of neuronal Fyn activity by Western blot quantification of the phosphorylation status of NR2B in striatal homogenates. Values indicate pNR2B/NR2B/β-actin ratio. No statistical analysis was applied because of two missing values in the R group. In all figures, data are mean ± SEM. In B–D, the black bar indicates mean ± SEM of the contralateral non-lesioned striatal samples, as a reference value and was not included in the statistical analysis.
Figure Contributions: Juan E. Ferrario and Sara Sanz-Blasco dissected brain structures. Melina P. Bordone and Tomas Eidelman performed mesencephalic slices and immunohistochemistry of TH. Tomas Eidelman quantified TH-positive cells and Melina P. Bordone made Western blottings.

