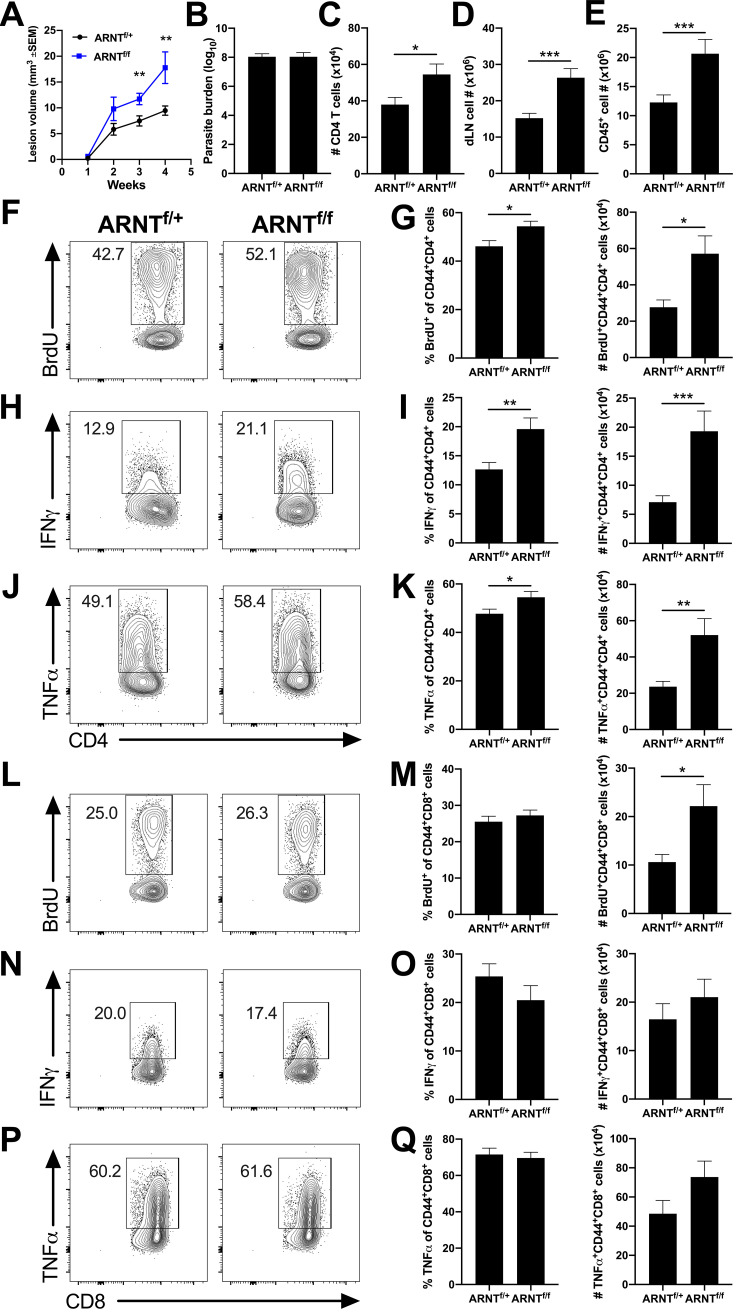
FIG 4.
Exacerbated inflammation in mice lacking myeloid pan-HIF signaling is associated with a heightened Th1 immune response during L. major infection. LysMCre ARNTf/f or LysMCre ARNTf/+ mice were infected with 2 × 10⁶ L. major metacyclic parasites intradermally in the ear. Immune cell populations were analyzed at 3.5 to 5 weeks postinfection (p.i.) when lesions developed. (A) Lesion volume was monitored weekly. (B) Parasite burdens were determined at 4 weeks p.i. by limiting dilution assay. Lesion and parasite count data were pooled from 2 independent experiments with 11 to 24 mice per group. (C) Infected ears were processed, and total cell numbers were counted. Cells were stained and analyzed by flow cytometry and the total number of CD4+ T cells was calculated. Dermal CD4+ T cell data shown here were pooled from 3 independent experiments (total of 29 LysMCre ARNTf/+ and 24 LysMCre ARNTf/f mice). (D to Q) The dLN of infected ears is the source of cells analyzed for T cell proliferation and cytokine production. dLN cells were treated with BFA/monensin and PMA/ionomycin for 4 h before surface and intracellular staining. (D) dLNs draining infected ears were processed and total cell numbers were counted. (E) Cells were analyzed by flow cytometry and the total number of CD45+ cells was calculated. dLN and CD45+ cell number data shown here were pooled from 3 independent experiments (total of 29 LysMCre ARNTf/+ and 22 LysMCre ARNTf/f mice). (F) Representative flow cytometry plots showing BrdU of CD4+ CD44+ T cells. (G) Quantification of percentage and number of BrdU+ cells of CD4+ CD44+ T cells. (H) Representative flow cytometry plots showing IFN-γ of CD4+ CD44+ T cells. (I) Quantification of percentage and number of IFN-γ+ cells of CD4+ CD44+ T cells. (J) Representative flow cytometry plots showing TNF-α of CD4+ CD44+ T cells. (K) Quantification of percentage and number of TNF-α+ cells of CD4+ CD44+ T cells. (L) Representative flow cytometry plots showing BrdU of CD8+ CD44+ T cells. (M) Quantification of percentage and number of BrdU+ cells of CD8+ CD44+ T cells. (N) Representative flow cytometry plots showing IFN-γ of CD8+ CD44+ T cells. (O) Quantification of percentage and number of IFN-γ+ cells of CD8+ CD44+ T cells. (P) Representative flow cytometry plots showing TNF-α on CD8+ CD44+ T cells. (Q) Quantification of percentage and number of TNF-α+ cells of CD8+ CD44+ T cells. All cells were pregated on total, live, singlet CD45+ cells. BrdU proliferation data shown here were pooled from 2 independent experiments (total of 11 LysMCre ARNTf/+ and 13 LysMCre ARNTf/f mice). Intracellular cytokine data were pooled from 3 independent experiments for IFN-γ (total of 29 LysMCre ARNTf/+ and 22 LysMCre ARNTf/f mice) and from 2 independent experiments for TNF-α (total of 23 LysMCre ARNTf/+ and 16 LysMCre ARNTf/f mice). Data are presented as the mean + SEM. *, P ≤ 0.05; **, P < 0.01; ***, P < 0.001, unpaired t test comparing infected LysMCre ARNTf/f mice to infected LysMCre ARNTf/+ controls.

