Figure 2.
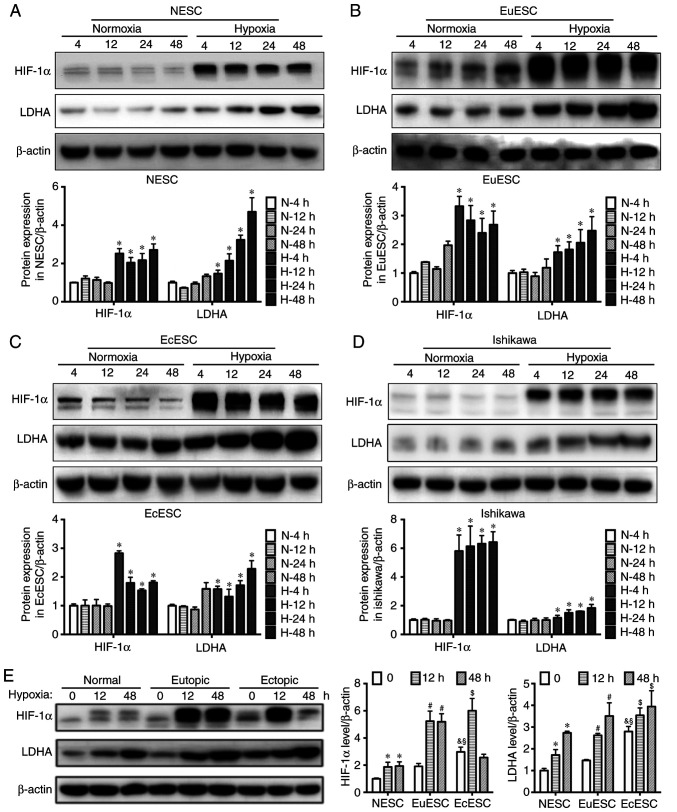
Hypoxia induces LDHA expression in endometrial cells. Western blot analysis of HIF-1α and LDHA expression in (A) NESCs, (B) EuESCs, (C) EcESCs and (D) Ishikawa cells at 4, 12, 24 and 48 h after culture in normoxic or hypoxic conditions. Upper panel shows protein bands, whereas the lower panel shows a histogram semi-quantifying the results of corresponding treatments. One-way ANOVA and Bonferroni post hoc test were used to analyze multiple comparisons. *P<0.05, hypoxia vs. normoxia group at the same time point. (E) Western blot analysis of HIF-1α and LDHA expression in NESCs, EuESCs and EcESCs after 12 or 48 h of normoxia or hypoxia. The left panel shows protein bands, the middle panel shows a histogram of HIF-1α expression in the three cell types, and the right panel shows a histogram of LDHA expression. β-actin was used as a loading control. Values are expressed as mean ± SD of three independent experiments. Two-way ANOVA and Bonferroni post hoc test were used to analyze multiple comparisons. *P<0.05, hypoxia vs. normoxia group in NESCs; #P<0.05, hypoxia vs. normoxia group in EuESCs; $P<0.05, hypoxia vs. normoxia group in EcESCs; &P<0.05, EcESCs vs. NESCs in normoxia; §P<0.05, EcESCs vs. EuESCs in normoxia. LDHA, lactate dehydrogenase A; HIF-1α, hypoxia inducible factor 1α; NESC, normal endometrial stromal cells; EuESC, eutopic endometrial stromal cells; EuESC, eutopic endometrial stromal cells.

