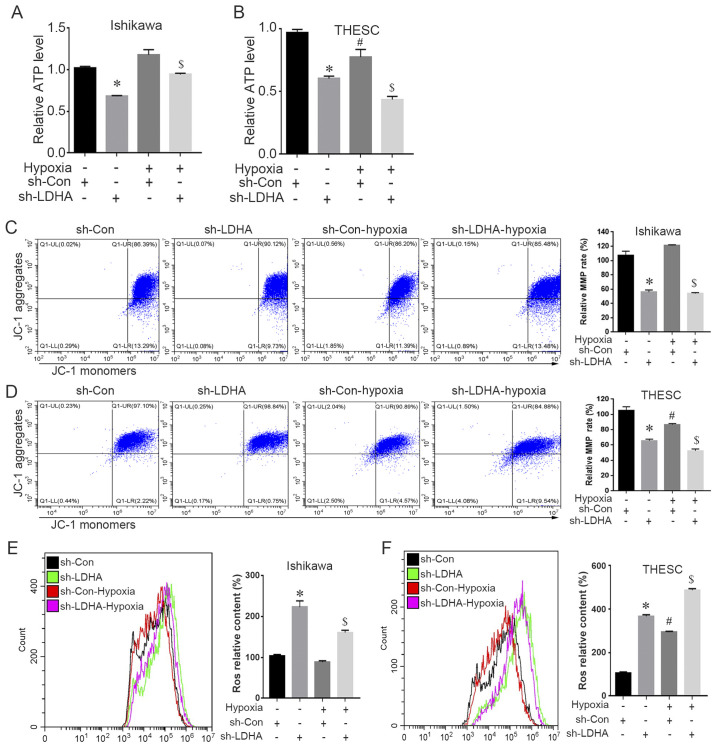
Figure 5.
Effect of LDHA-knockdown on mitochondrial function of Ishikawa cells and THESC cells. Intracellular ATP levels in (A) Ishikawa cells and (B) THESC cells after 24 h of culture under normoxic or hypoxic conditions. The MMP ratio was measured by flow cytometry in (C) Ishikawa cells and (D) THESC cells. The left panels show representative graphs of MMP values detected by flow cytometry and the right panels show a histogram of the MMP ratio. Intracellular ROS levels in different treatment groups of (E) Ishikawa cells and (F) THESC cells were determined by 2′-7′dichlorofluorescin diacetate fluorescence. The left panels show representative graphs of intracellular ROS levels detected by flow cytometry and the right panels show a histogram of the ROS relative content. Values are expressed as mean ± SD of three independent experiments. Two-way ANOVA and Bonferroni post hoc test were used to analyze multiple comparisons. *P<0.05, sh-LDHA vs. sh-Con in normoxia; #P<0.05, normoxia vs. hypoxia in sh-Con group; $P<0.05, sh-LDHA vs. sh-Con in hypoxia. LDHA, lactate dehydrogenase A; MMP, mitochondrial membrane potential; ROS, reactive oxygen species; sh-, short hairpin; Con, control.

