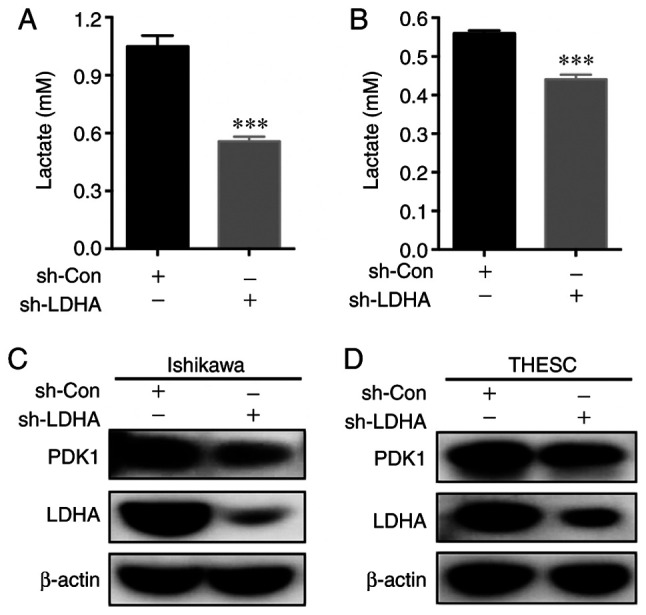
Figure 6.

Effect of LDHA-knockdown on metabolism of Ishikawa cells and THESC cells. Histograms showing relative lactate expression in (A) Ishikawa cells and (B) THESC cells. LDHA-knockdown (sh-LDHA) significantly reduced lactate levels compared with their respective control groups (sh-Con). Protein expression levels of PDK1, a key enzyme in glycolysis, were determined by western blotting in (C) Ishikawa cells and (D) THESC cells. β-actin was used as a loading control. Values are expressed as mean ± SD of three independent experiments. Student's t-test was used to compare two groups. ***P<0.001 vs. sh-Con. LDHA, lactate dehydrogenase A; h-, short hairpin; Con, control; PDK1, pyruvate dehydrogenase kinase 1.
