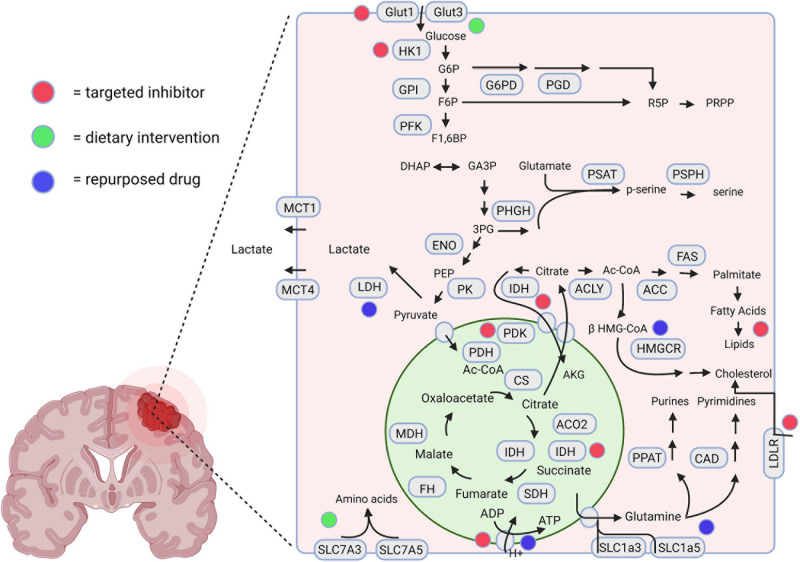
FIGURE 2.
A schematic representation highlighting the therapeutic interventions associated with GBM metabolism. The red, green, and blue dots depict the interventions using novel targeted inhibitors, dietary interventions, and repurposed drugs, respectively. Created using Biorender.com.

