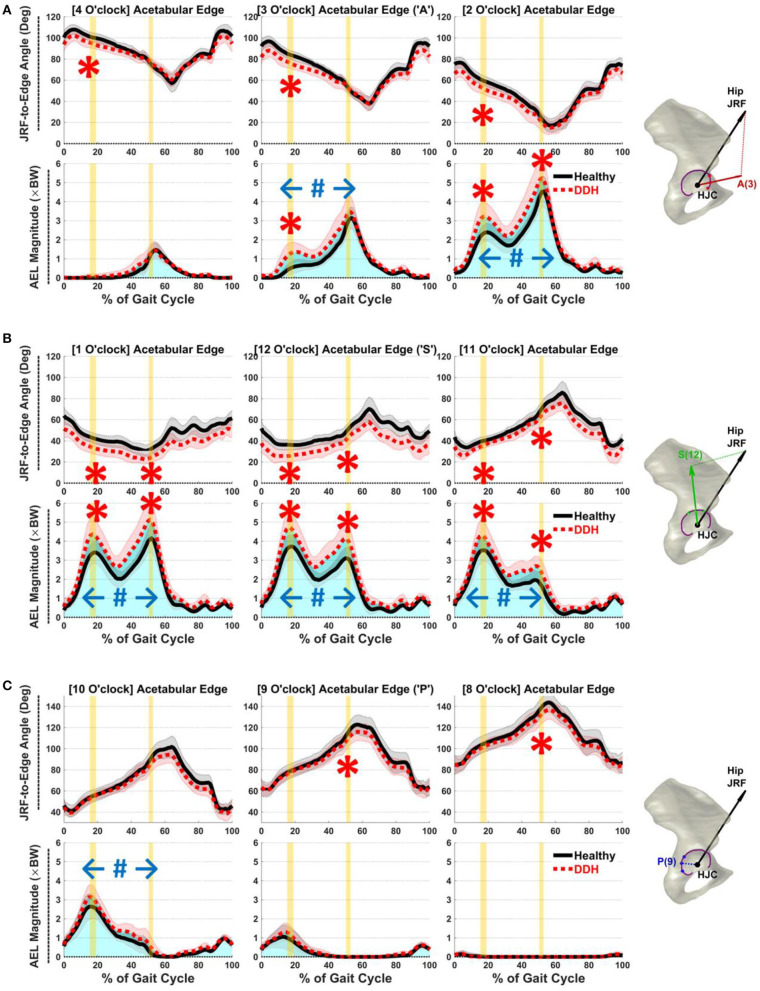
Figure 3.
Average JRF-to-edge angles (top) and AEL (bottom) in (A) anterior (2–4 o'clock), (B) superior (11–1 o'clock), and (C) posterior (8–10 o'clock) regions throughout gait. Red/black shades = ±1 SD. Vertical yellow bars indicate time of JRF peaks (JRF1 and JRF2). Blue shades (total area under the curves) illustrate accumulative impulses. Statistical significance: “*” instantaneous, “#” accumulative.

