FIGURE 2.
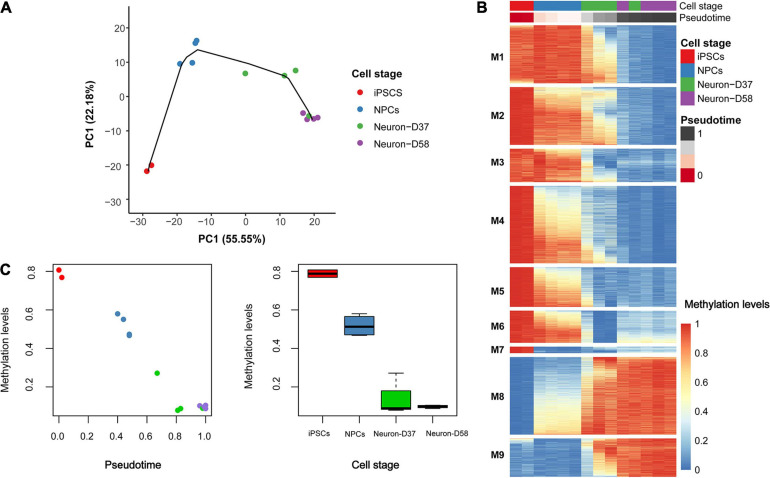
Trajectory inference modeling identifies a signature of 6,843 probes that distinguish cell stage. (A) To create the trajectory model dimensionality reduction was first performed, using principal component analysis (PCA), followed by estimating pseudo-time to model the lineage trajectory. The different samples grouped together based on the first two principal components (PCs). (B) Using the pseudo-time estimation, a generalized additive model (GAM) was used to determine which of the 6,843 probes were becoming hypomethylated (blue) or hypermethylated (red) over time. The patterns of hypomethylation and hypermethylation were grouped into nine modules (M1-9) that could distinguish the different cell stages. (C) The DNA methylation patterns occurring at the most significant probe (cg00908292) throughout differentiation. Left: plot of methylation beta-value (Y-axis) against pseudo-time (X-axis) and right: plot of methylation beta-value (Y-axis) against cellular stage (X-axis).

