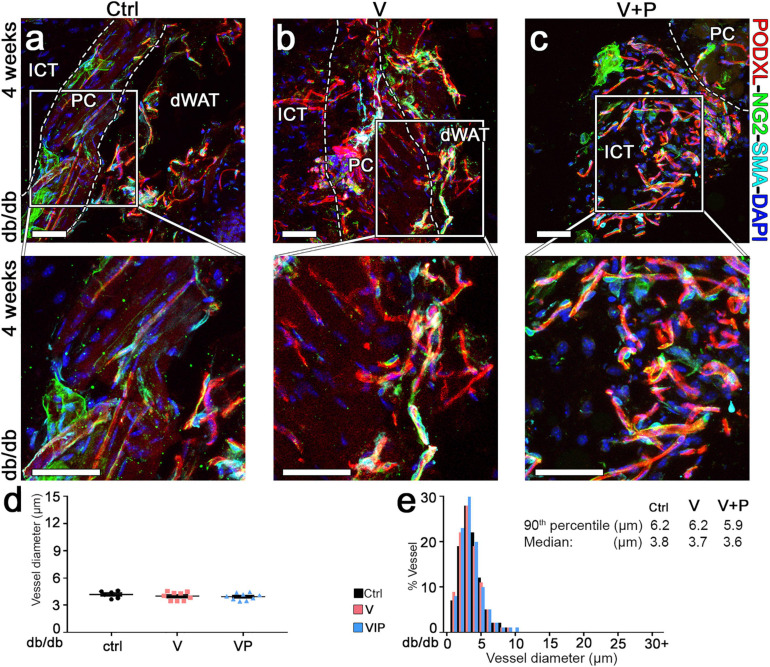
FIGURE 6.
Long-term maturation and size of angiogenic vessels in diabetic skin. (a–c) Vascular morphology was analyzed 4 weeks after implantation of V, VP or control (ctrl) empty fibrin gels, by immunofluorescence staining for podocalyxin (endothelial cells, red), NG2 (pericytes, green), α-SMA (smooth muscle cells, cyan), and DAPI (nuclei, blue). The lower panels show higher-magnification views of the areas marked by the white squares in the top panels. Size bars = 50 μm in all panels; dWAT, dermal adipose white tissue; PC, panniculus carnosus; ICT, interstitial connective tissue. (d,e) Vessel diameters (in μm) were quantified and results are shown as mean values of each sample ± SEM (d) and as the distribution of vessel diameters over 1-μm intervals (e); n = 6–9 samples/group.

