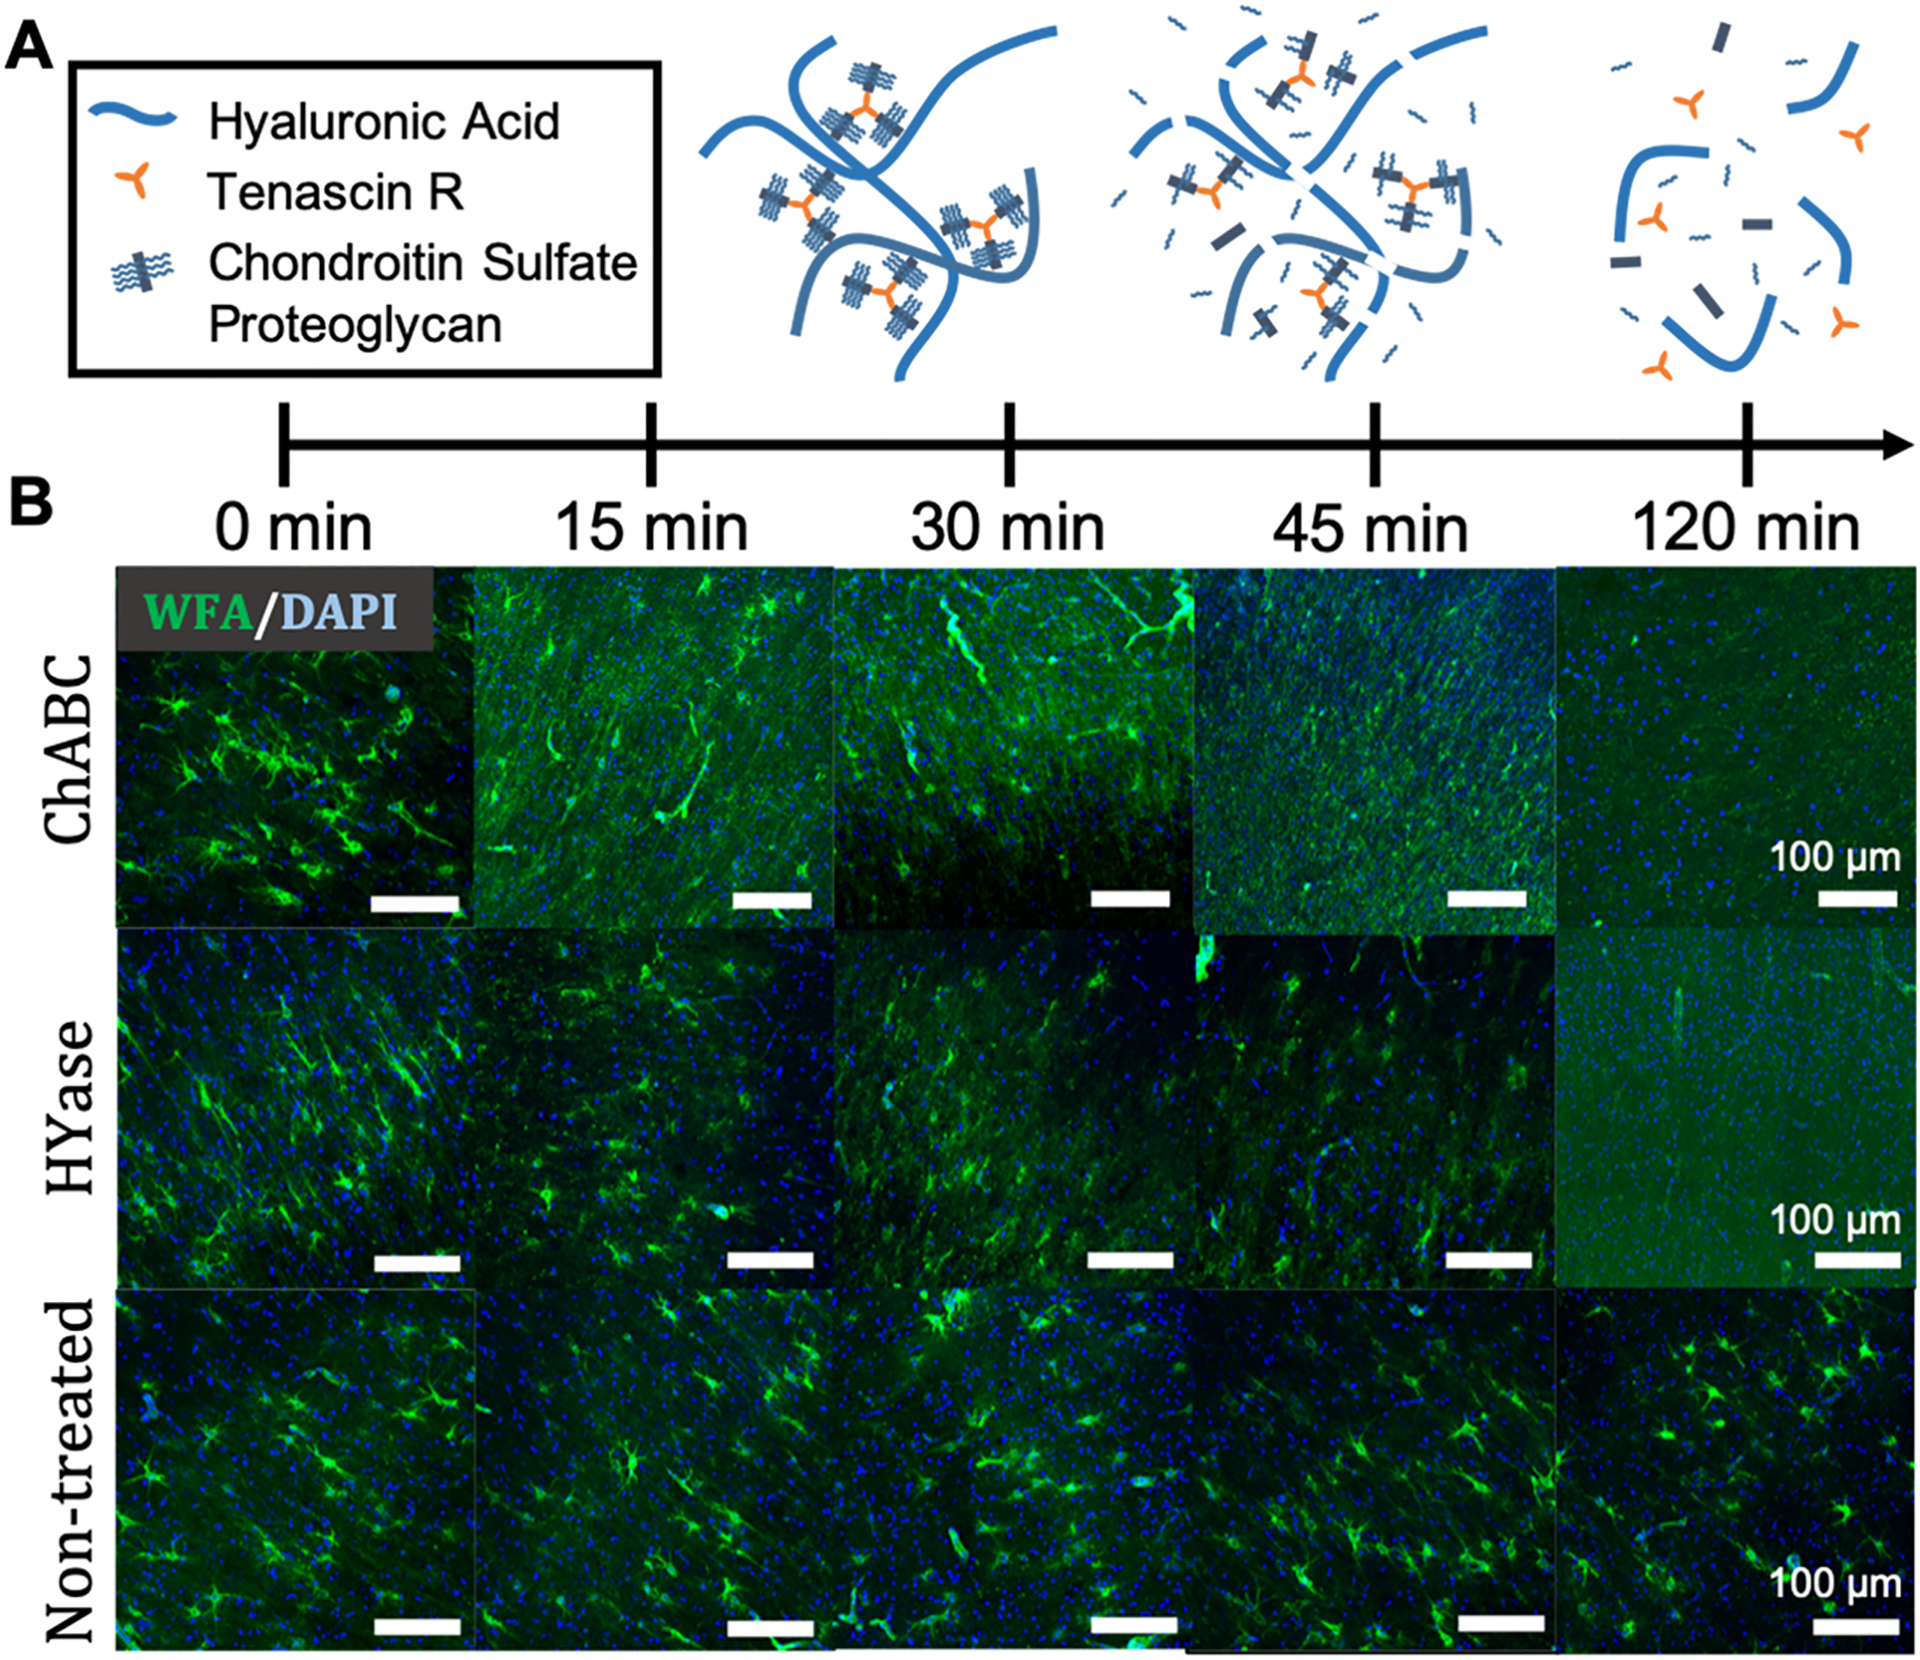
Figure 3.

PNN structures degrade within 2 h following treatment with either ChABC or HYase. (A) Schematic representation of PNN breakdown following treatment with HYase or ChABC. (B) Representative 20× magnification images taken from the cortex of P35 rat brain slices receiving one of three treatments (HYase, ChABC, or SCM). PNNs were stained with WFA (green) and cell nuclei stained with DAPI (blue). Rows represent treatment group. Columns represent treatment time. Scale bars: 100 μm.
