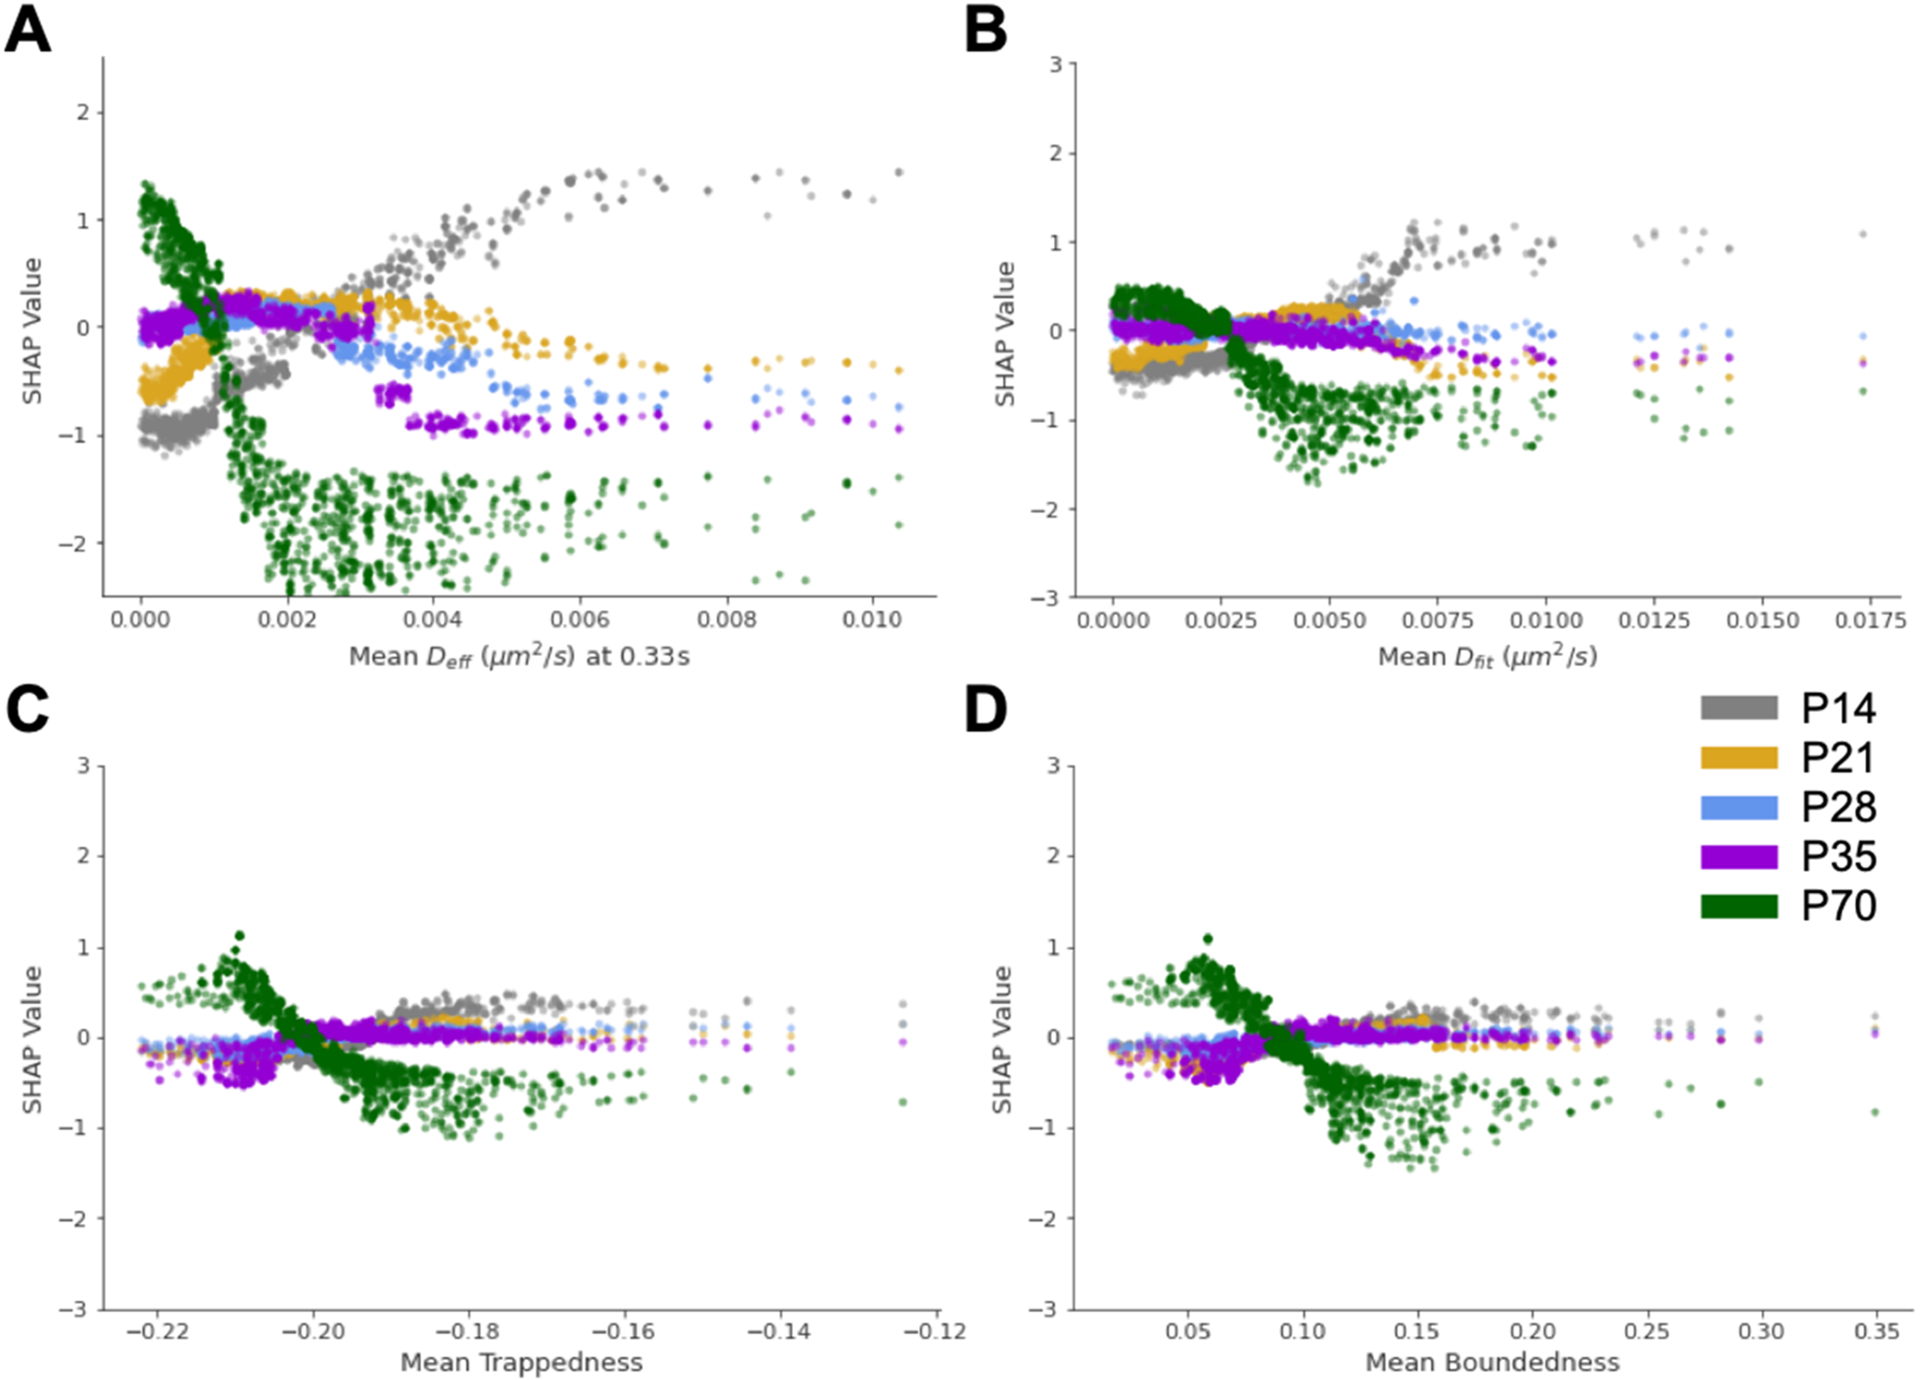
Figure 6.

SHAP dependence plots for the four most influential features in the 5-age boosted decision tree classifier. SHAP dependence plots for (A) mean Deff, (B) mean Dfit, (C) mean trappedness, and (D) mean boundedness. Color scheme: P14 = gray, P21 = gold, P28 = blue, P35 = purple, P70 = green.
