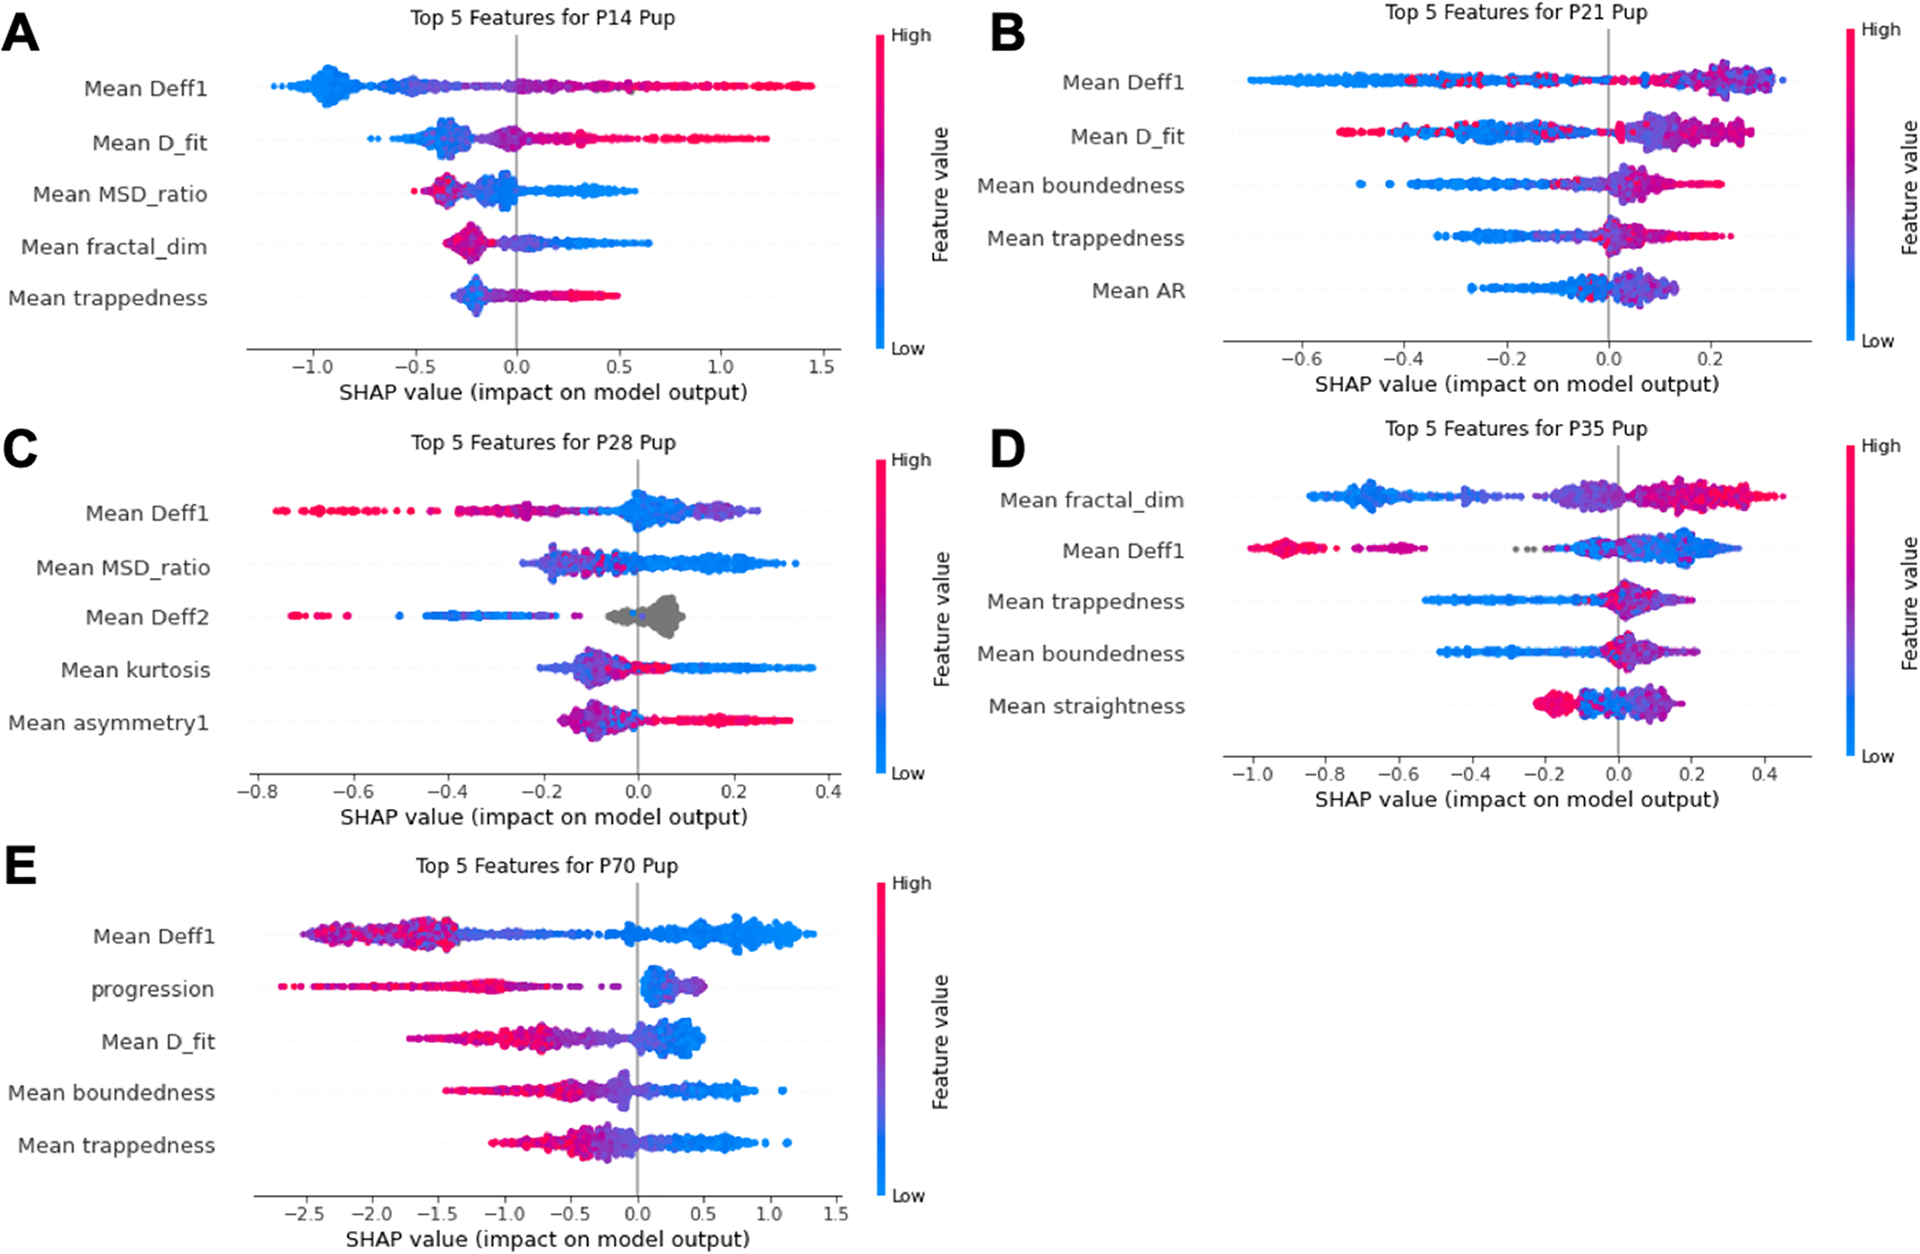
Figure 7.

SHAP summary plots for each age of the 5-age boosted decision tree classifier. SHAP summary plots of the five most influential features for predicting the (A) P14, (B) P21, (C) P28, (D) P35, and (E) P70 age groups. Colorbar provides feature magnitude from low (blue) to high (red).
