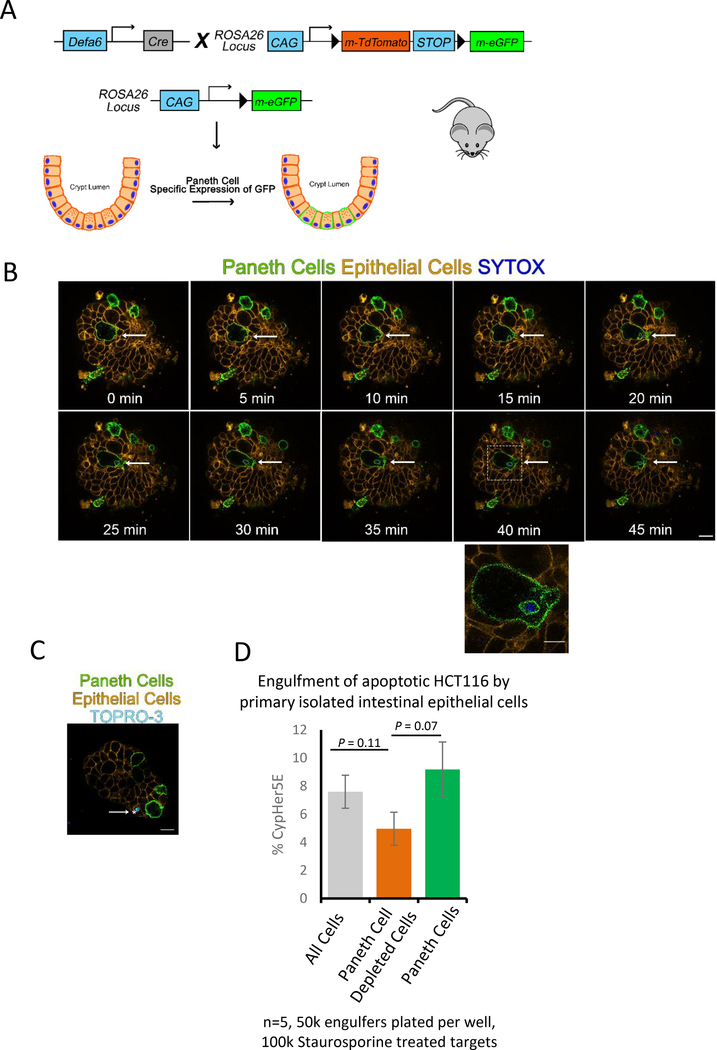
Figure 3: Paneth cells can mediate uptake of apoptotic cells.
(A) Diagram of Paneth cell tracing mouse (Defa6-cremTmG) generation.
(B) Frames from live imaging of enteroids from Defa6-cremTmG. Arrow indicates cell that was killed using laser ablation with a 405nm laser and partially engulfed by neighboring Paneth cell (Green). Enteroid was scanned once every 5min by a LSM780 scanning confocal microscope with temperature and CO2 controlled environmental chamber. 63X oil objective. Scale bar = 10 μm. Zoom in region Scale bar = 5 μm. (See also Figure S3 and Video S3).
(C) Defa6-cremTmG (iECs = orange, Paneth Cells = green) co-stained with TO-PRO-3. Arrows indicate cells that have ingested DNA from a dying cell. Imaged on a Zeiss LSM780 with a 63X oil objective. Scale bar = 10 μm.
(D) Percentage of mouse iECs from Defa6-cremTmG mice that engulfed apoptotic HCT116 cells. Two tailed t-tests were used to compare groups. Bars are standard error of five independent experiments. (See also Figure S4).

