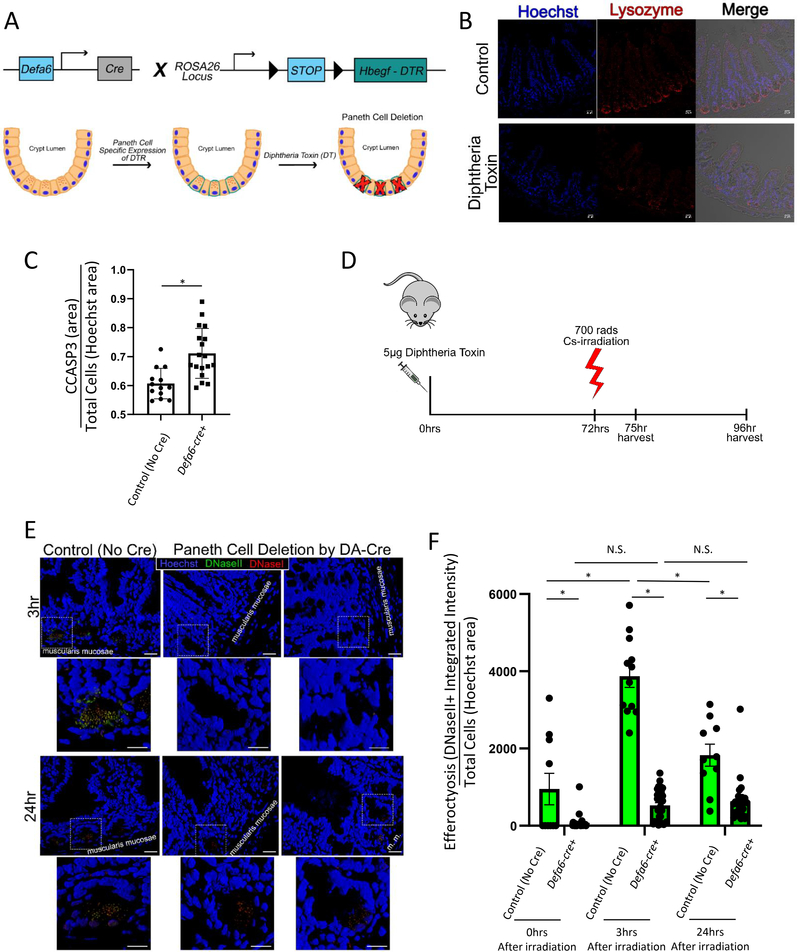
Figure 4: Specific ablation of Paneth cells reduces cell clearance in vivo after irradiation.
(A) Schematic of diphtheria toxin induced Paneth cell depletion approach.
(B) Immunofluorescence staining of 4% PFA fixed paraffin embedded 5μm sections from Paneth cell depleted, irradiated mice stained for nuclei (Hoechst = blue), and Paneth cells (lysozyme = red). Imaged on a Zeiss LSM880 with a 20X air objective. Scale bar = 20 μm.
(C) Quantification of CCASP3 staining area as a function of Hoechst staining area in intestinal crypts (jejunum) prior to irradiation. Unpaired two tailed t-test was used to determine statistical significance p < 0.05.
(D) Timeline of diphtheria toxin induced Paneth cell depletion and analysis.
(E) Three dimensional rendering of Paneth cell depleted, irradiated mice stained for Apoptag (DNaseI = red, DNaseII = green) with nuclear counterstaining (Hoechst = blue). Imaged on a Zeiss LSM780 with a 63X oil objective. Three dimensional rendering created using Zen Black. Original images scale bar = 20 μm. Zoom-in images scale bar = 10 μm.
(F) Quantification of DNaseII activity (integrated intensity) in intestinal crypts (in jejunum) after 700 rads 137Cs-irradiation normalized to cell density (Hoechst nuclear counterstaining area) using FIJI. 0hr: Defa6-cre- (control) n = 13, Defa6-cre+ n = 30; 3hr: Defa6-cre- (control) n = 12, Defa6-cre+ n = 33; 24hr: Defa6-cre- (control) n = 10, Defa6-cre+ n = 27. 2-way ANOVA with Tukey post tests were used to determine statistical significance. p < 0.05.

