
Fig. 4 |. A-IDPs exhibit tunable intracellular droplet formation on the basis of the molecular weight and ratio of aromatic to aliphatic content.
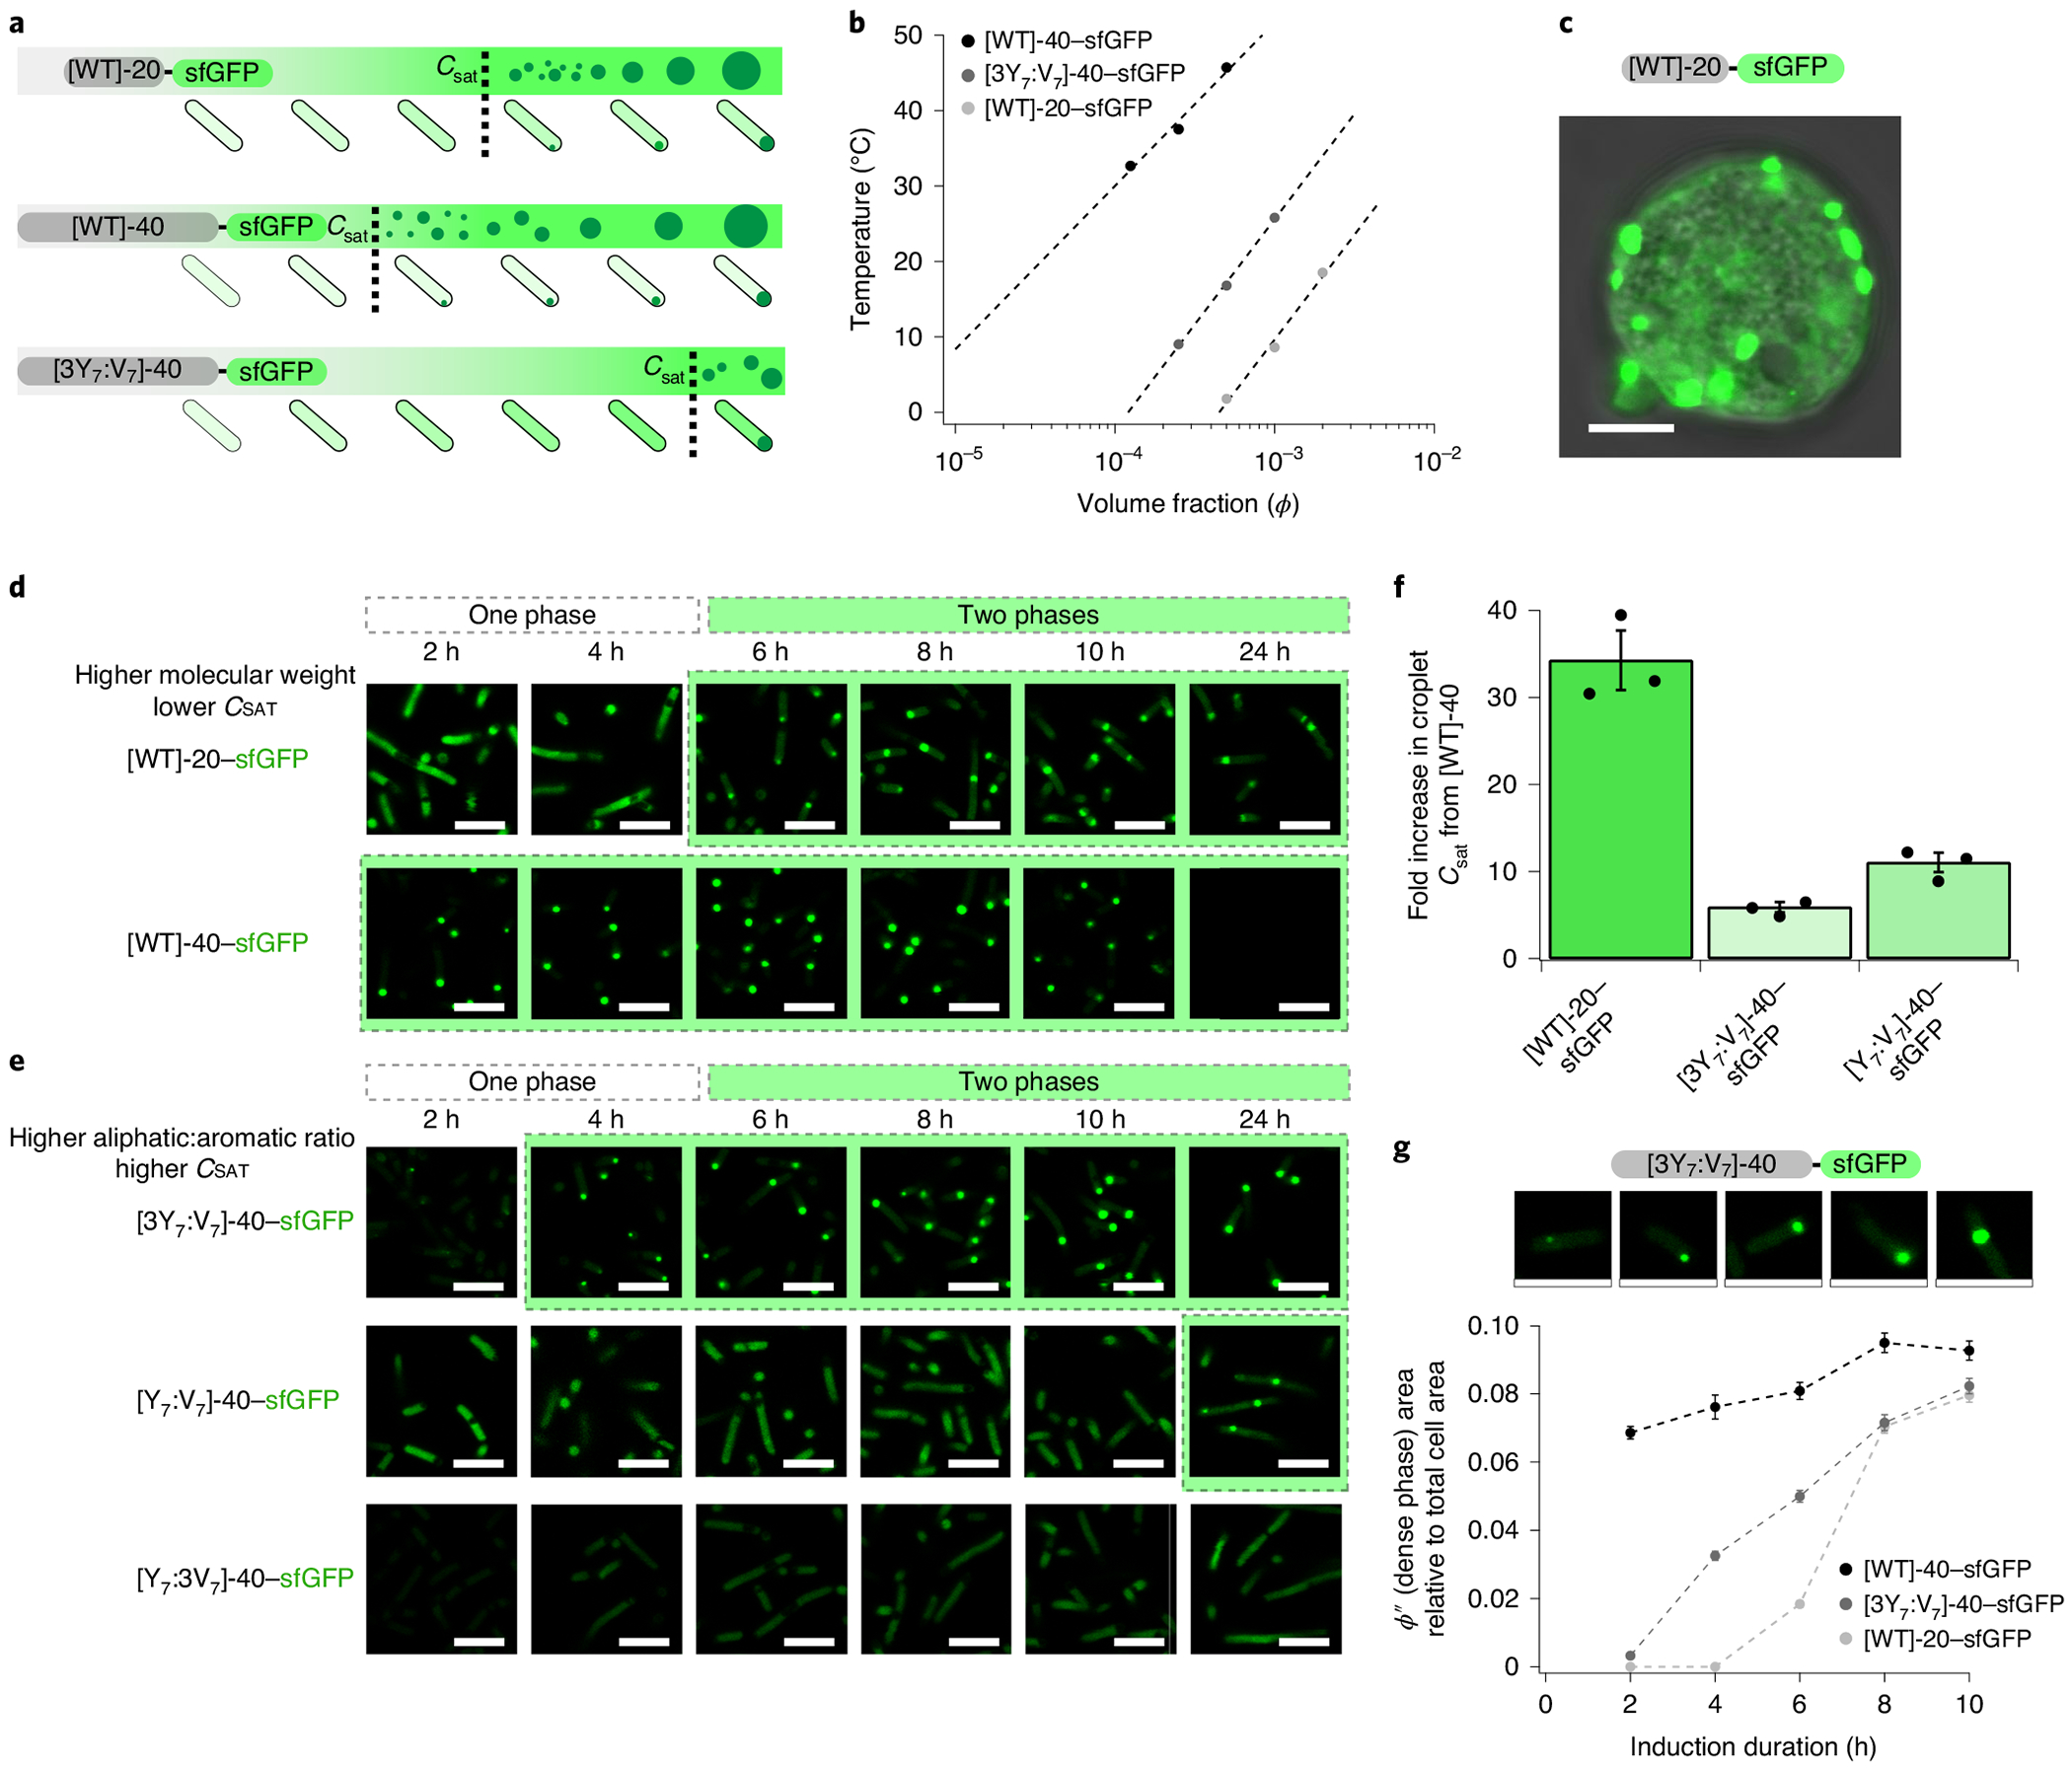
a, A schematic describing the use of two key parameters (the ratio of aromatic:aliphatic content and the molecular weight) to control intracellular droplet formation by modulating Csat. b, A partial in vitro binodal of A-IDP–sfGFP fusions in the dilute regime in 150 mM PBS, pH 7.4. Similar to A-IDPs, A-IDP–GFP fusion proteins exhibit molecular weight and aromatic content dependent phase behaviour. c, The [WT]-20–sfGFP fusion undergoes phase separation in eukaryotic cells (HEK293 cells, day five). Instead of forming a single droplet as seen in vitro in protocells (see Fig. 1c), many distinct droplets are formed that indicate either diffusion- or arrest-limited coalescence. d, Confocal fluorescence images of A-IDP–sfGFP as a function of induction time and molecular weight in E. coli. A higher intracellular concentration is required for [WT]-20 versus [WT]-40 to form intracellular droplets. It is noticeable that [WT]-40 has a lower ϕ′ (A-IDP poor) soluble phase outside of the dense droplet phase compared with [WT]-20. e, Reducing the aromatic content increases Csat in a dose-dependent manner. f, A-IDP–sfGFP fusions exhibit a one order of magnitude shift in their Csat as determined by their molecular weight and ratio of aromatic:aliphatic content. g, The size of the intracellular droplets (ϕ″ or dense phase) grows with induction time. As the concentration of the A-IDP–sfGFP increases inside the cell, the soluble concentration outside of the droplet does not change (Supplementary Fig. 14) but the size of the intracellular droplets grows relative to the total cell area. Images are individual cells from [3Y7:V7]-40–sfGFP cultures at various time points. Error bars represent the standard error of the mean (n = 100 individual cells). All scale bars, 5 μm.