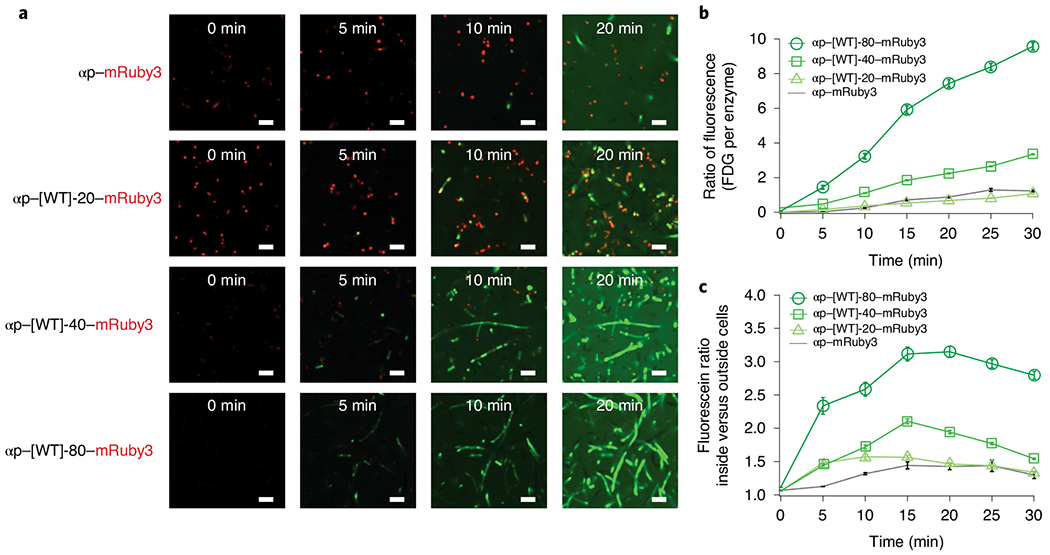
Fig. 7 |. Engineered intracellular droplets with programmable function.

a, Confocal microscopy images showing the fluorescent conversion of fluorescein FDG. Note that the puncta-like structures of αp–mRuby3 in the top panel are due to a fraction of the fusion forming inclusion bodies in cells. When the αp is fused with [WT]-20–mRuby3, the fluorescence is first observed at the sites of intracellular phase transition in coacervate droplets, and the fluorescein then diffuses into the cytosol and then out of the cell into the extracellular space. Increasing the molecular weight of the A-IDP leads to increased FDG conversion at earlier timepoints and higher overall conversion after 20 min. Rebalanced images of αp–[WT]-40–mRuby3 and αp–[WT]-80–mRuby3, with improved visualization of the co-localization of intracellular droplets and converted FDG, can be found in Supplementary Fig. 20. b, Intracellular concentration of fluorescein produced by catalytic conversion of FDG, normalized to the mRuby3 fluorescence of each individual cell (n = 300). The catalytic efficiency increases with A-IDP molecular weight, as seen by the greater ratio of green fluorescence resulting from FDG conversion to fluorescein normalized to the red fluorescence of mRuby3 on a molar basis. Both αp–[WT]-40–mRuby3 and αp–[WT]-80–mRuby3 exhibit statistically significant differences from the control (two-factor ANOVA, F < 2 × 10⁻¹³). Error bars indicate standard error of the mean. c, All αp–A-IDP–mRuby3 fusions exhibit a higher ratio of green fluorescence inside the cell, indicating a greater persistence of fluorescent FDG inside the intracellular space compared to the αp–mRuby3 control. Error bars represent the standard error of the mean. n = 300. All scale bars, 5 μm.
