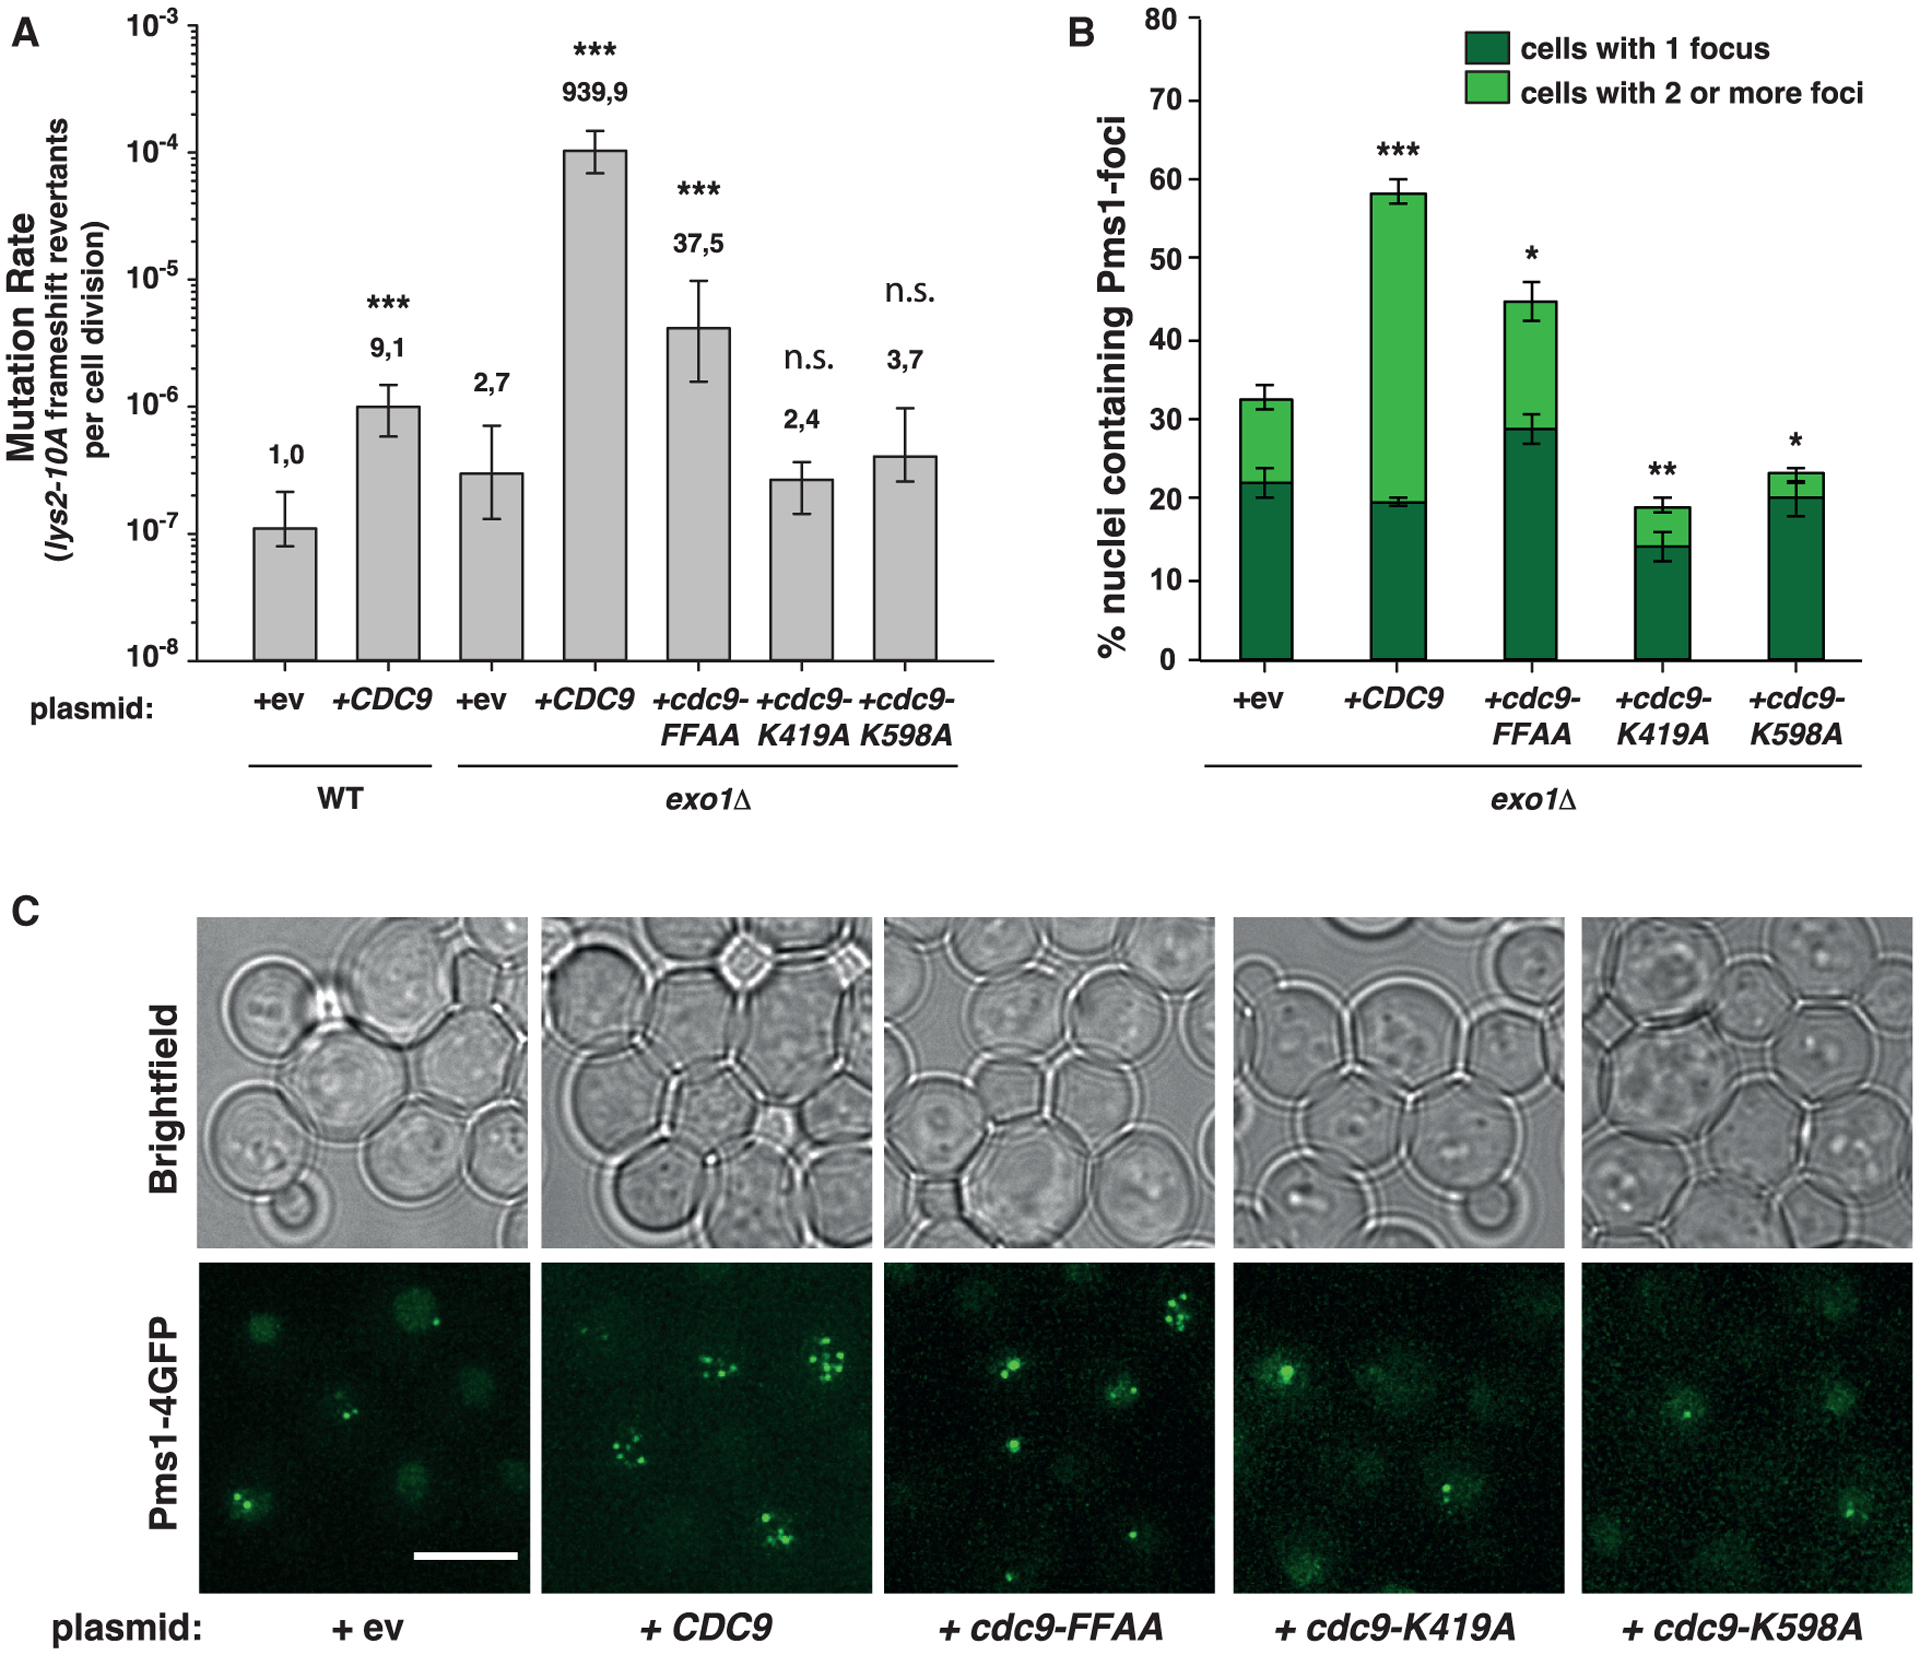
Figure 1. Increased Cdc9 activity results in elevated mutation rates and accumulation of Pms1 foci.

(A) Mutation rate analysis using the lys2-10A frameshift reversion assay in WT or exo1Δ strains carrying plasmids (2μ) bearing WT-CDC9, the PCNA interaction-deficient cdc9-FFAA mutant, the ligase-defective mutants cdc9-K491A and cdc9-K598A, or an empty vector (ev). Bars correspond to the median rate, with error bars corresponding to the 95% confidence interval. Numbers on top of the bars indicate fold increase in mutation rate relative to the WT strain. See also Figure S1 and Table S1.
(B) Percentage of cells containing Pms1-4GFP foci in exo1Δ strains transformed with plasmids shown in (A). Bars represent the average of the percentage of nuclei containing foci; error bars represent standard error of the mean (SEM).
(C) Representative fluorescent microscopy live-cell images of cells containing Pms1 foci used for quantification shown in (B). Brightfield images are shown on top. Scale bar represents 5 μm. p values indicated in (A) and (B) were calculated with the Mann-Whitney rank-sum test using SigmaPlot. *p ≤ 0.05; **p ≤ 0.01; ***p ≤ 0.001; n.s., not significant.
