
Figure 2. Cdc9 overexpression interferes with both Exo1-dependent and Exo1-independent MMR pathways.
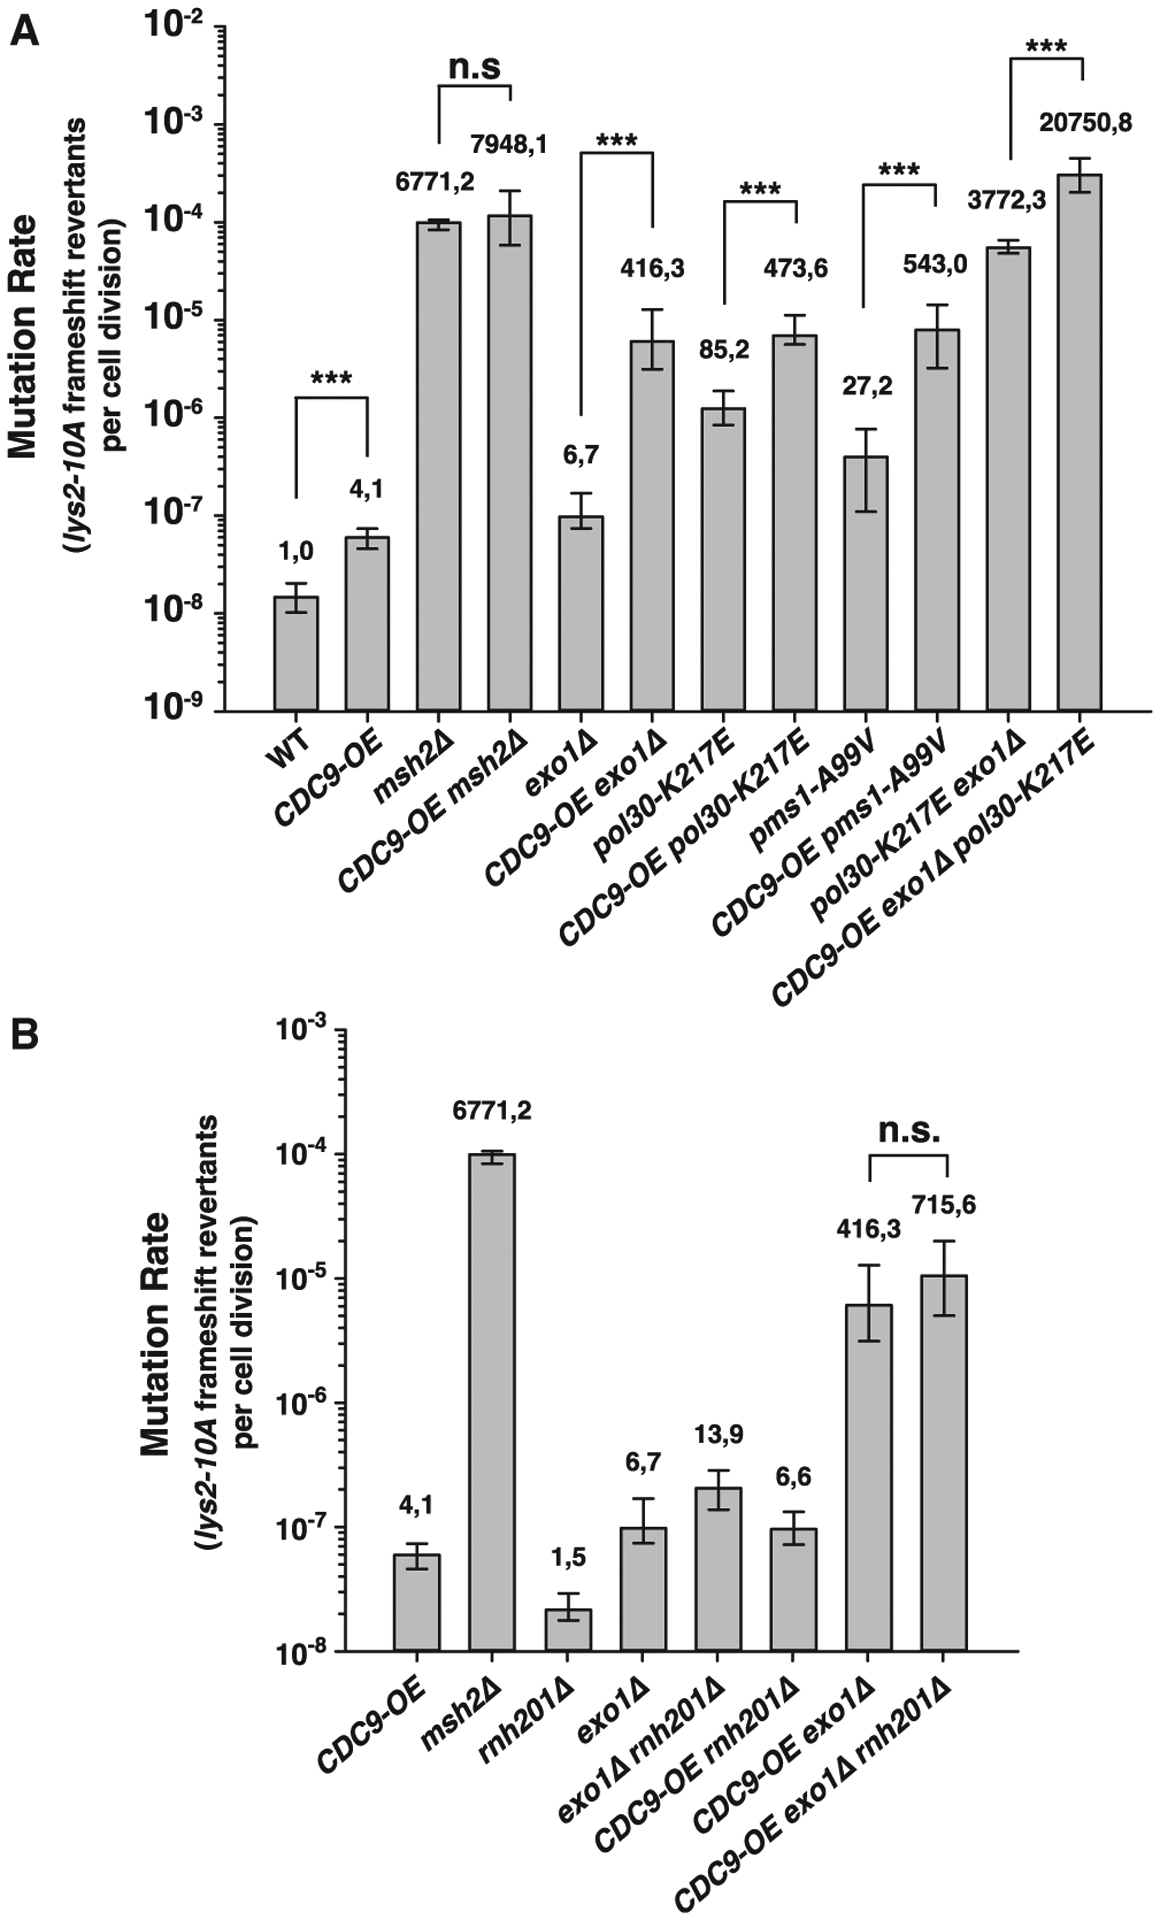
(A and B) Mutation rate analysis using the lys2-10A frameshift reversion reporter in the indicated yeast genetic backgrounds. Bars correspond to the median rate, with error bars representing the 95% confidence interval. Numbers on top of the bars indicate fold increase in mutation rate relative to WT. p values were calculated with the Mann-Whitney rank-sum test using SigmaPlot. ***p ≤ 0.001; n.s., not significant. See also Table S2 for additional mutation rate analysis using two alternative mutational reporters.