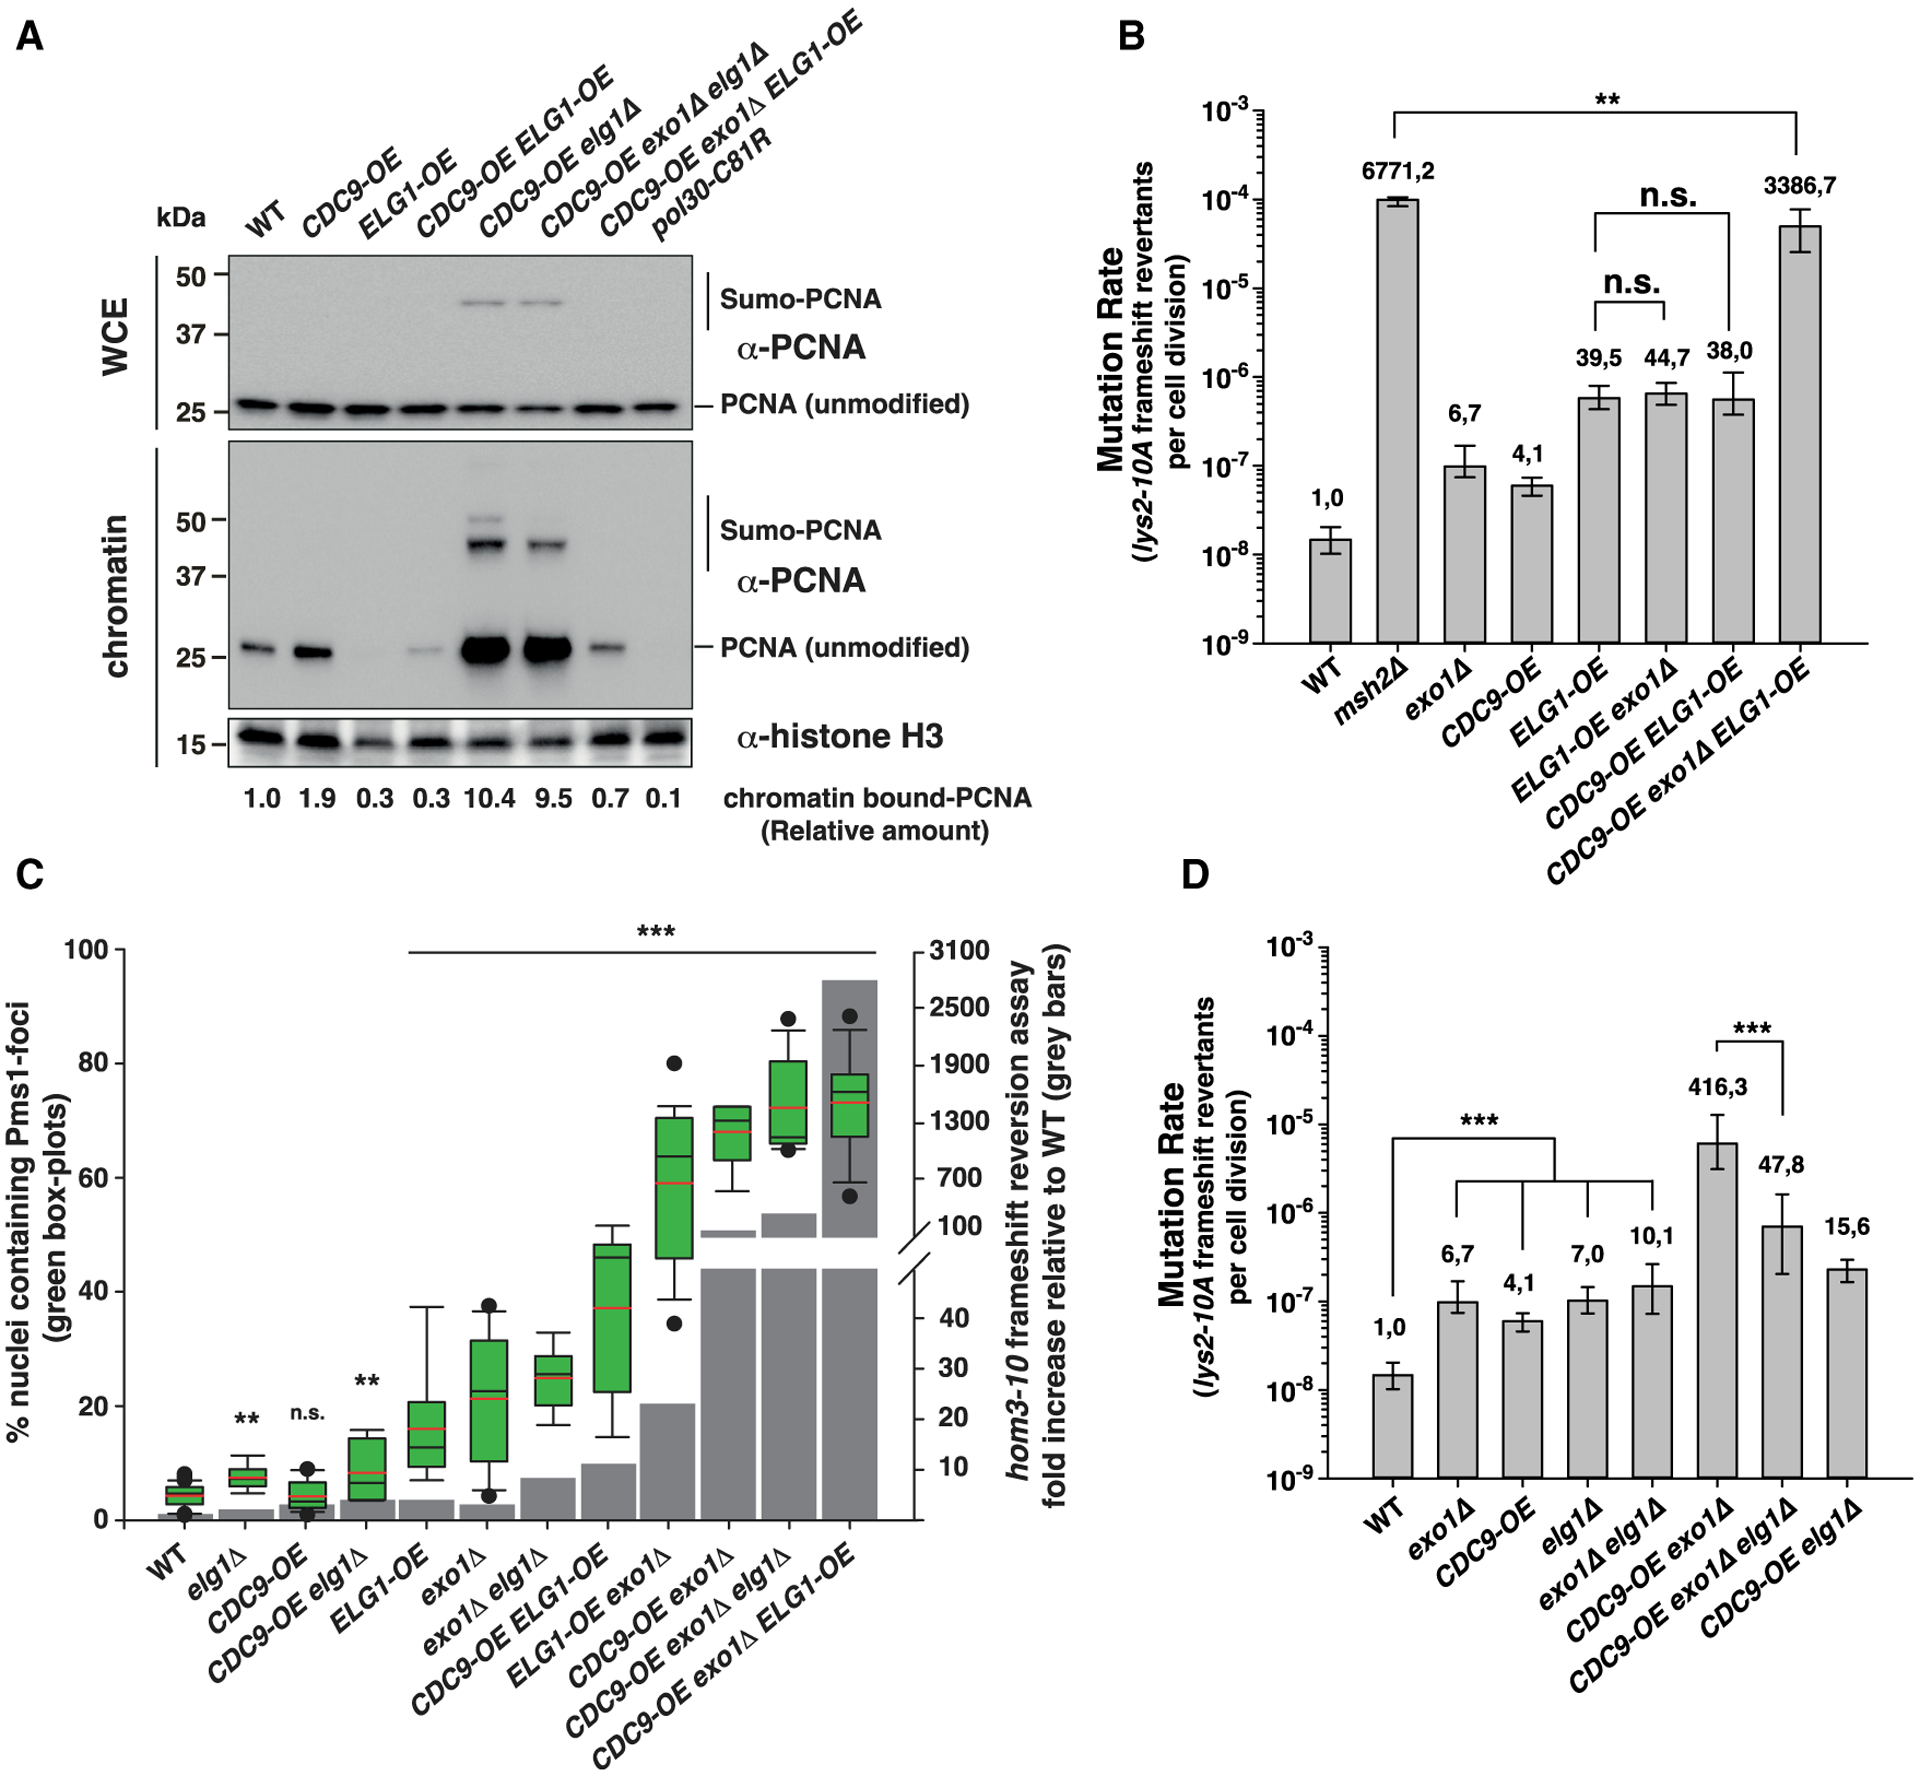
Figure 3. Increased mutagenesis caused by Cdc9 overexpression is not due to the premature unloading of PCNA from DNA.

(A) PCNA levels in whole cell extracts (WCE) and chromatin fractions. Histone H3 was the loading control. See also Figure S1D.
(B–D) In (B) and (D): mutation rate analysis using the lys2-10A frameshift reversion reporter in the indicated yeast genetic backgrounds. Bars correspond to the median rate, with error bars indicating the 95% confidence interval. Numbers on top of the bars indicate fold increase in mutation rate relative to WT. See also Table S2 for additional mutation rate analysis and Tables S3 and S4 for CAN1 mutation spectra analysis. (C) Correlation between Pms1-foci abundance and frameshift mutator phenotype (hom3-10 assay). Quantification of Pms1-4GFP foci in boxplot with whiskers; dots represent outliers; black and red lines inside the boxplot represent the median and the average, respectively. Statistical analysis indicated in (C) was performed relative to WT. p values shown in (B)–(D) were calculated with the Mann-Whitney rank-sum test using SigmaPlot. **p ≤ 0.01; ***p ≤ 0.001; n.s., not significant.
