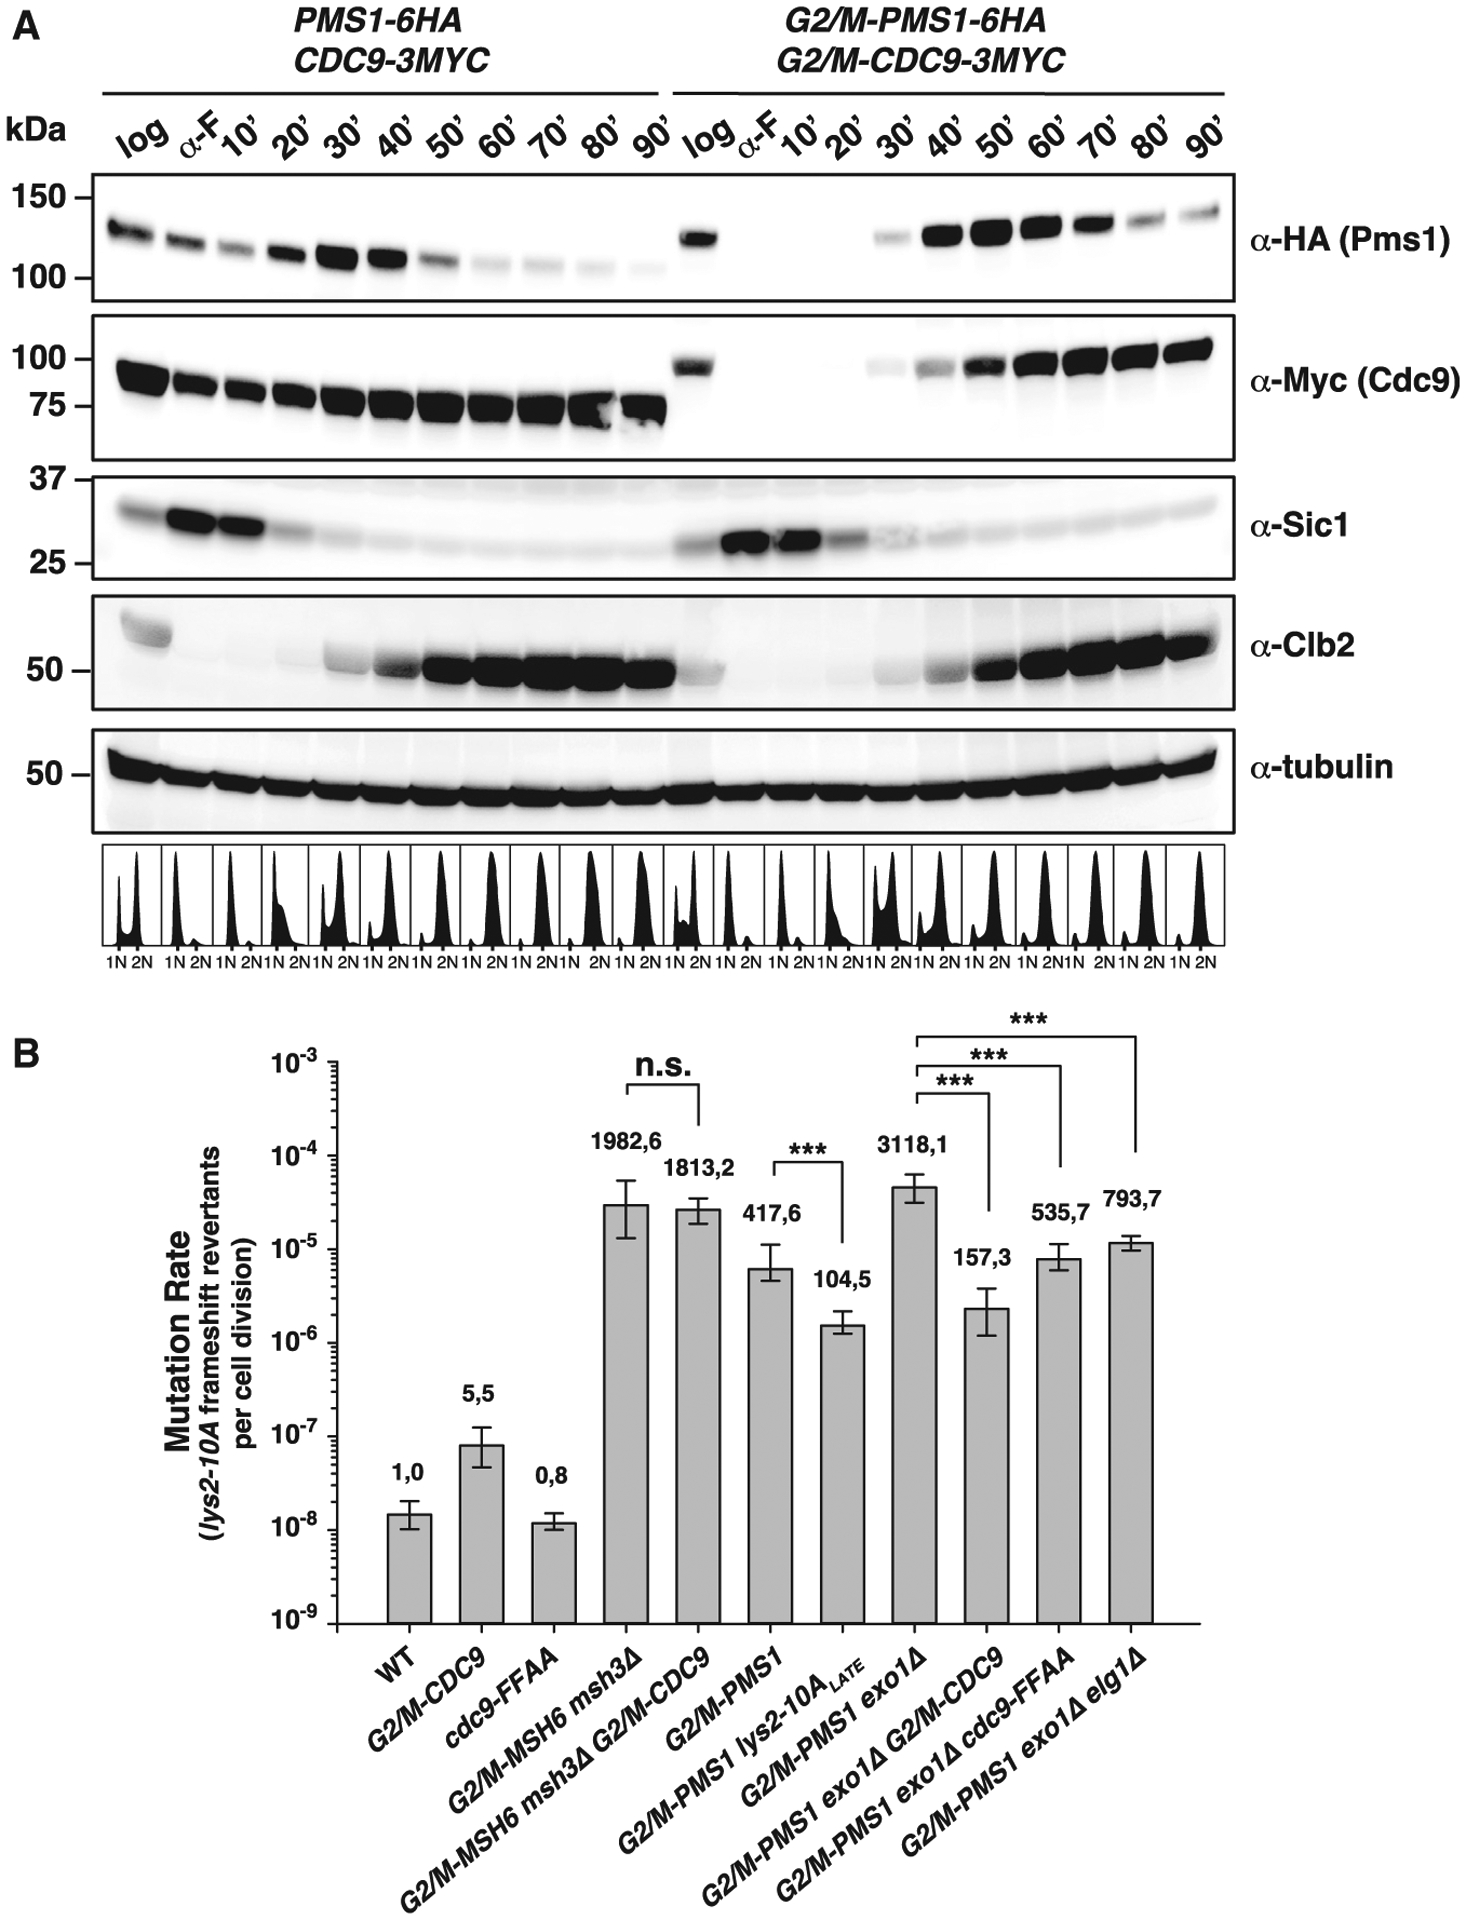
Figure 4. Cdc9 activity dictates a window of time for MMR strand discrimination.

(A) Top: Pms1 and Cdc9 protein expression levels throughout the cell cycle under endogenous regulation (PMS1–6HA and CDC9–9MYC) or under control of the G2/M-tag (G2/M-PMS1–6HA and G2/M-CDC9–9MYC). Bottom: logarithmically growing cells (log), α-factor-arrested cells (α-F), or cells arrested and released from α-F arrest for the indicated time were analyzed by western blotting and DNA content analysis. Sic1, Clb2, and tubulin serve as G1-, G2/M-phase, and loading controls, respectively. See also Figures S2 and S3.
(B) Mutation rate analysis using the lys2-10A frameshift reversion assay in the indicated strains. Bars correspond to the median rate, with error bars representing the 95% confidence interval. Numbers on top of the bars indicate fold increase in mutation rate relative to the WT. p values were calculated with the Mann-Whitney rank-sum test using SigmaPlot. ***p ≤ 0.001; n.s., not significant. See also Table S5 for additional mutation rate analysis using two alternative mutational reporters.
