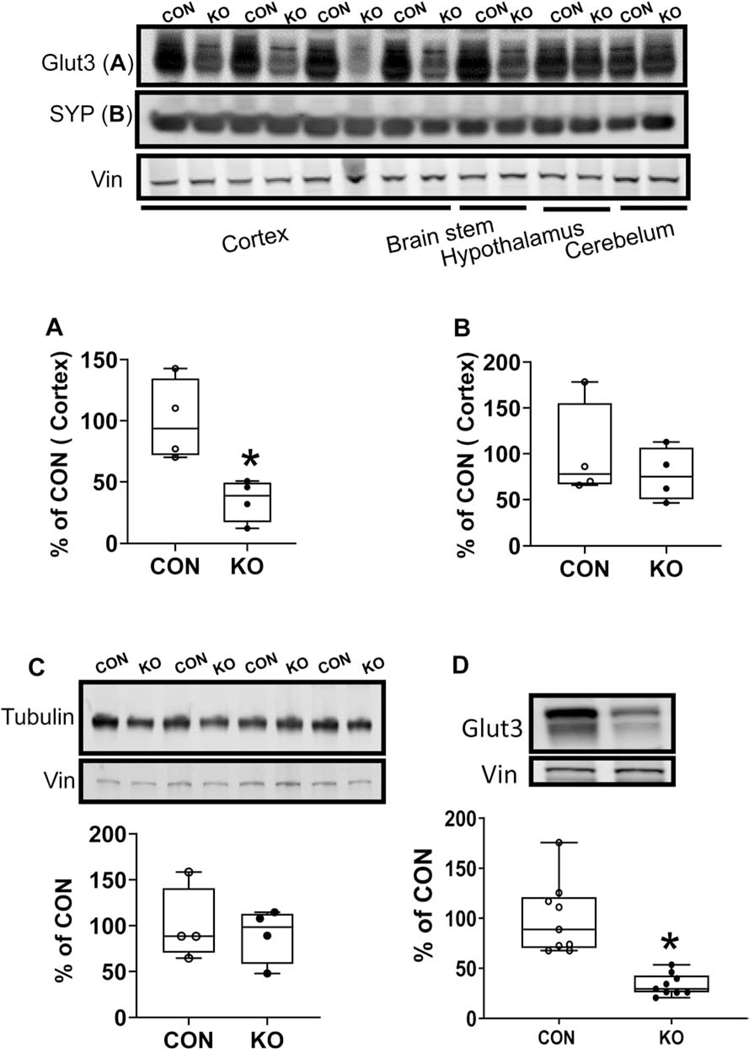
Figure 3.
Western blot analysis of Glut3 (A and D), Synaptophysin (SYP)(B) and Tubulin (C) proteins in the cerebral cortex of 2 month (A-C) or 10–12-month-old mice (D). Top, Representative Western blots with Glut3, Synaptophysin (SYP) and Tubulin shown above and vinculin (internal control) shown below. Bottom, Densitometric quantification of corresponding proteins shown as percent of CON. A, the expression of GLUT3 was reduced significantly in KO by 60% compared to CON. (t statistic [df: 6] = 3.451, *p-value = 0.0136 n=4 each for CON and KO, by unpaired t test). B, there was no difference between CON and KO mice with SYP (t statistic [df: 6] = 0.7476, p-value = 0.4830), n = 4 for each group. C, there was no difference between CON and KO mice in the case of Tubulin (t statistic [df: 6] = 0.4021, p-value = 0.7015), n = 4 for each group. D, the expression of GLUT3 was reduced significantly in KO by 67% compared to CON. (t statistic [df: 16] = 5.297, *p-value < 0.0001, n=9 each for CON and KO, by unpaired t test).

