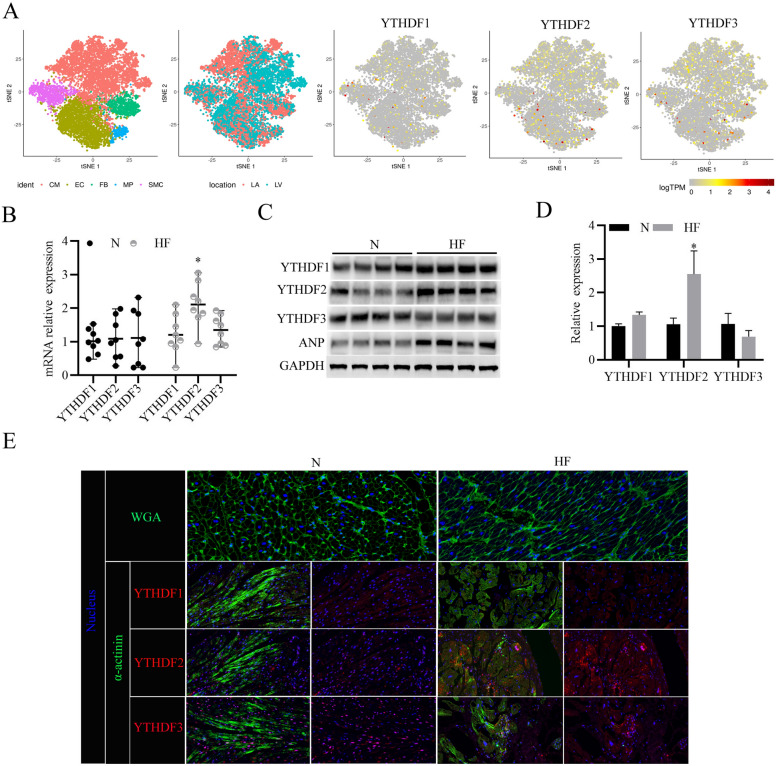
Fig. 1.
YTHDF2 protein expression increases in human heart failure samples. A 2D visualization of single-cell clusters of TAC-model mouse heart tissues by tSNE. (CM cardiomyocytes; EC endothelial cells, FB fibroblasts, MP macrophages, SMC smooth muscle cells); 2D visualization of single-cell clusters present in the left ventricle (LV) and the left atrial (LA); 2D visualization of YTHDF1/2/3 gene expressions in the single-cell clusters present in the left ventricle. B RT-PCR analysis of YTHDF1/2/3 mRNA expressions in the clinical HF (n = 8) tissues and the normal (N) heart tissues (n = 8). C Western blotting analysis of YTHDF1/2/3 protein expressions in the clinical HF (n = 4) tissues and the normal (N) heart tissues (n = 4). ANP was used as a positive control, and GAPDH was used as a loading control. D Densitometry quantification of protein expressions. E WGA staining (Green) was used to measure cardiomyocyte size of the clinical HF tissues and the normal (N) heart tissues; Immunofluorescence analysis of YTHDF1/2/3 (Red) expressions in cardiomyocytes (stained with anti-α-actinin antibodies, Green). Nucleus was stained with DAPI (Blue). *P < 0.05

