
Fig. 2.

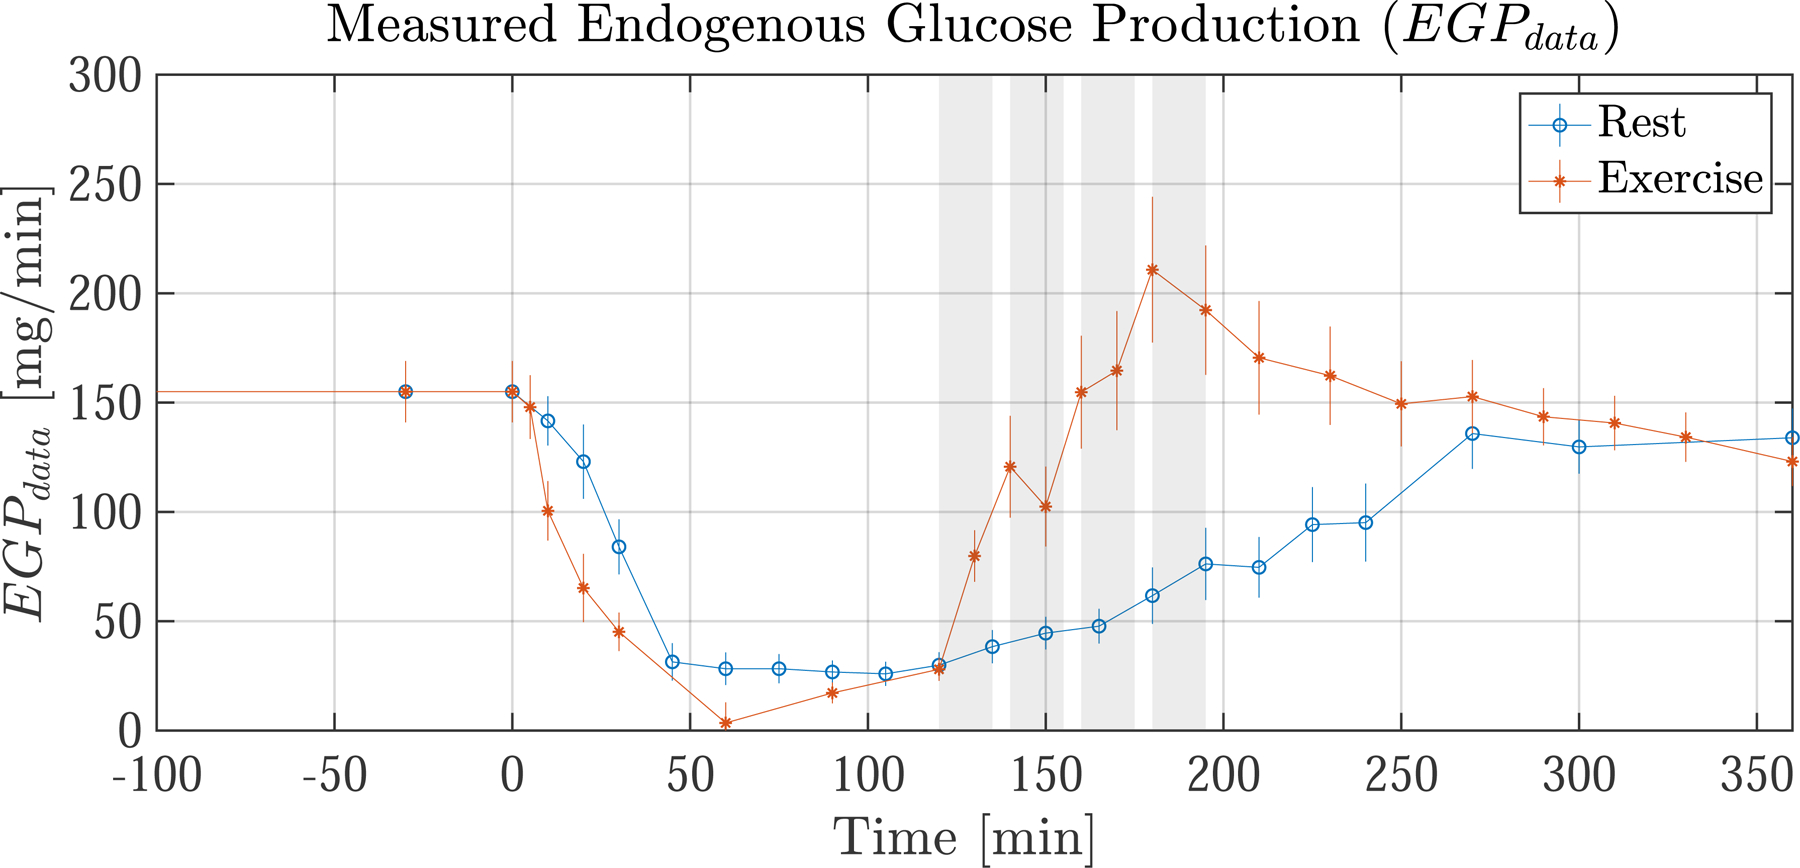
Average glucose flux measurements from healthy nondiabetic resting subjects (blue) and exercising subjects (orange). (top) Measured rate of meal appearance (Rameal), which is used as an input to the model. (bottom) Measured endogenous glucose production (EGPdata) which is not an input but is used for comparison to the EGP model predictions (see Fig. 6). Meal ingestion occurs at t= 0. The exercising subjects have four 15 min exercise bouts from t = 120–195 shown by shaded regions (shaded regions do not apply to resting subjects). During exercise EGPdata is seen to increase rapidly. Error bars indicate the standard error of the mean (SEM)