
Figure 9.
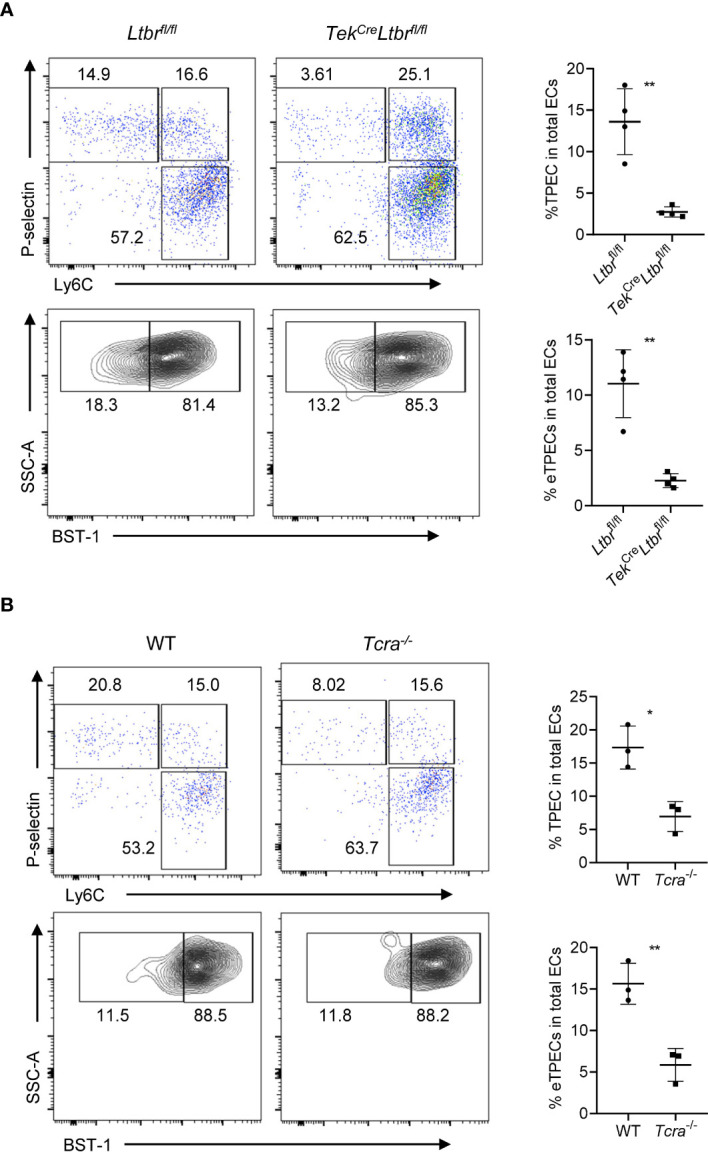
LTβR signaling and T cells regulate the development of eTPECs. (A) Flow cytometric analysis of TPEC and eTPECs in Ltbr fl/fl and Tek Cre Ltbr fl/fl mice. Left: Representative plots are shown. Right: Graphs display the statistical analysis of the percentage of TPECs or eTPECs. Mean ± SEM; n = 4. Data are representative of at least three independent experiments. (B) Flow cytometric analysis of TPEC and eTPECs in WT and Tcra −/− mice. Left: Representative plots are shown. Right: Graphs display the statistical analysis of the percentage of TPECs or eTPECs. Mean ± SEM; n = 3. Data are representative of two independent experiments. *P < 0.05; **P < 0.01 (unpaired Student’s t-test).