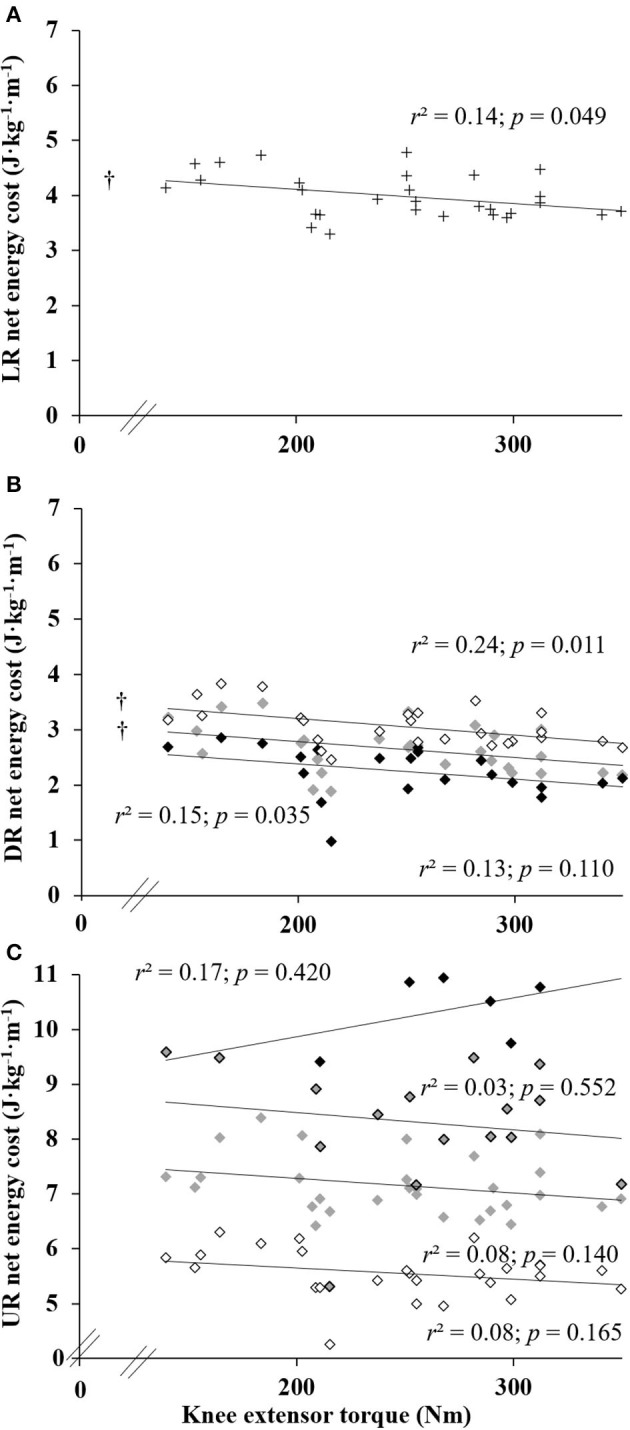
Figure 3.

Relationships between the knee extensor torque and the energy cost of running in level (LR) (A), downhill (DR) (B) and uphill running (UR) (C). Symbols “+” for 0%, ↓ for ±5%, υ for ±10%, υ for +15% and υ for ±20%; † indicate a statistically significant correlation (p < 0.05).
