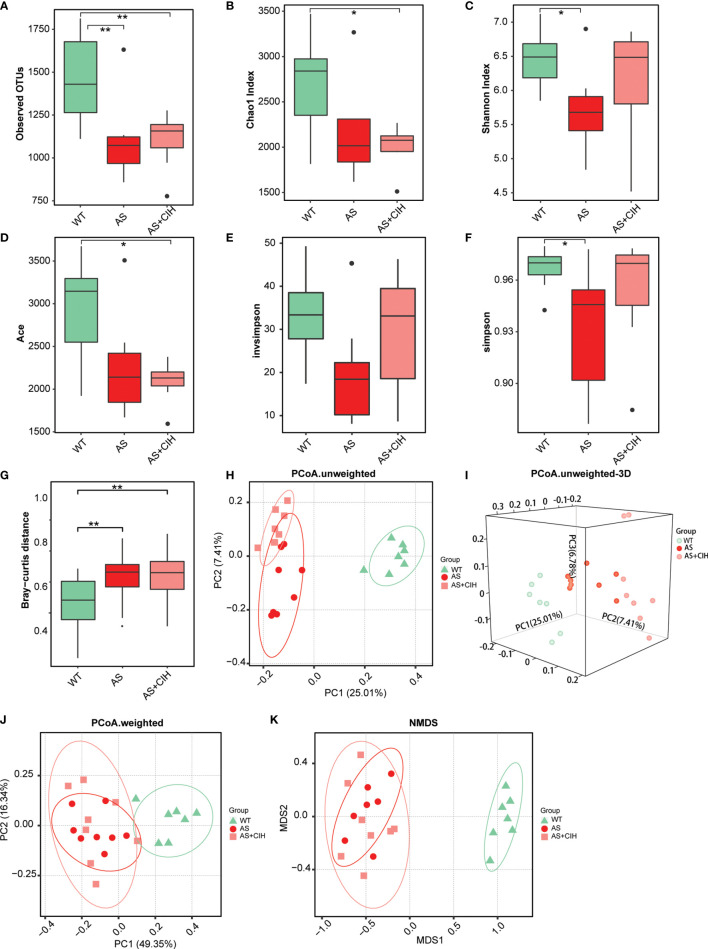
Figure 2.
Gut microbial diversity within-sample (α) and between-sample (β) in CIH treated apoE-/- mice fed with HFD. (A) Number of observed OTUs in control (WT), AS and atherosclerotic mice with CIH (AS+CIH). b-f. Parameters of α-diversity at the genus level, including Chao index (B), Shannon index (C), Ace (D), invsimpson (E) and simpson (F) among groups. (G) Bray-curtis distance, parameters of β-diversity in the WT, AS and AS+CIH groups. The boxes represent the inter quartile ranges, whereas the inside line represent the median and the points are outliers. *P value < 0.05, **P value < 0.01, Kruskal-Wallis. (H, J) Unweighted (H) and weighted (J) unifrac PCoA plots of samples from groups at the genus level. (I) 3D version of the unweighted unifrac PCoA plots. (K) NMDS plots of each sample based on abundances of the genera. n=7 for WT, and n=8 for AS and AS+CIH.

